The XBI enters the first quarter of 2026 with a stable but cautious tone. Investors see improving liquidity, yet risk appetite remains selective. Moreover, late‑stage companies attract more attention as early‑stage names still face tighter funding. This dynamic creates a mixed environment across the sector.
Furthermore, regulatory activity stays steady as the FDA maintains a normal approval pace. This consistency supports companies with near‑term catalysts. However, clinical data releases continue to drive sharp price swings. As a result, volatility remains a defining feature of the index.
Finally, valuations sit near long‑term averages, which reduces extreme downside pressure. Capital flows show stabilization but not broad enthusiasm. Even so, strategic deals and partnerships may offer support during the quarter. Overall, the sector may deliver moderate and uneven performance as fundamentals guide sentiment.
Elliott Wave Structure: XBI Weekly Chart September 09th 2025
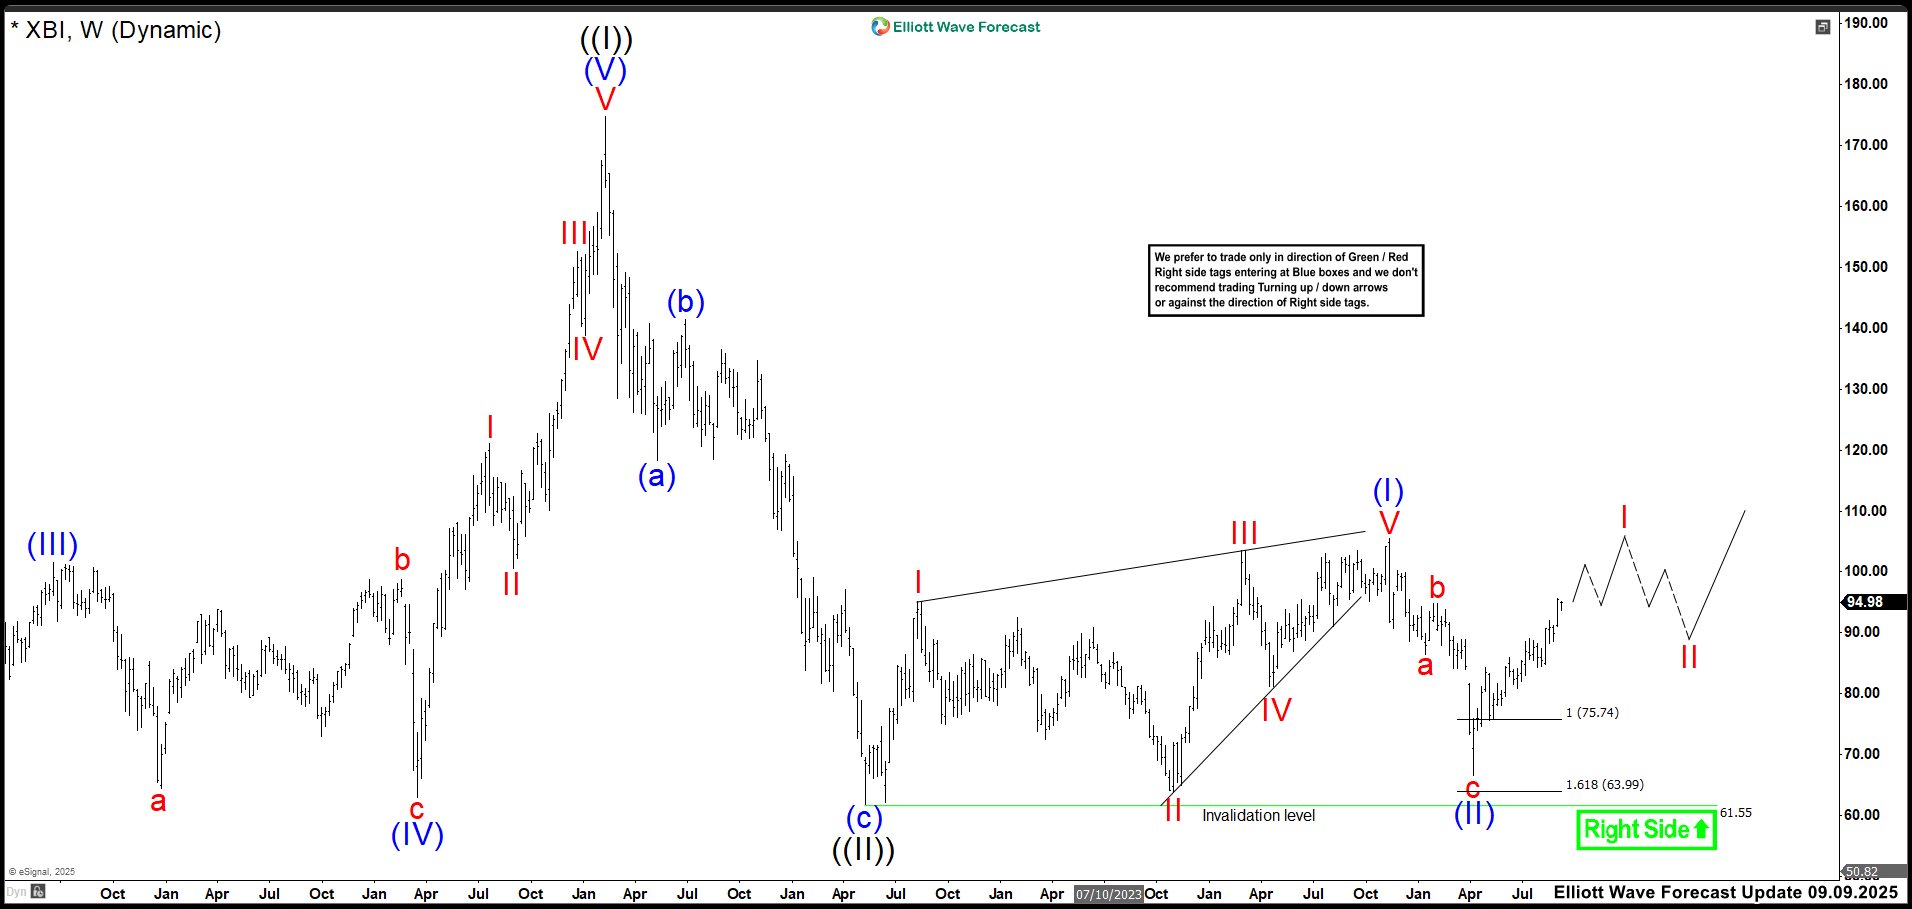
In the last update, we observed that wave (II) ended at the low of 66.66, right within the expected zone. The price then moved higher, aligning with our forecast. XBI was trading at 94.98, delivering an impressive return of approximately 30%. We believed the price should continue rising to complete the impulsive structure as wave I. The final target for wave I remained uncertain, but we relied on the fractal structure to guide us. This helps us to anticipate when a correction may begin, whether it unfolds in 3, 7, or even 11 swings, as part of wave II.
If you're eager to dive deeper into Elliott Wave Theory and learn how its principles apply to market forecasting, you might find these resources helpful: Elliott Wave Education and Elliott Wave Theory.
Elliott Wave Structure: XBI Weekly Chart February 14th 2026
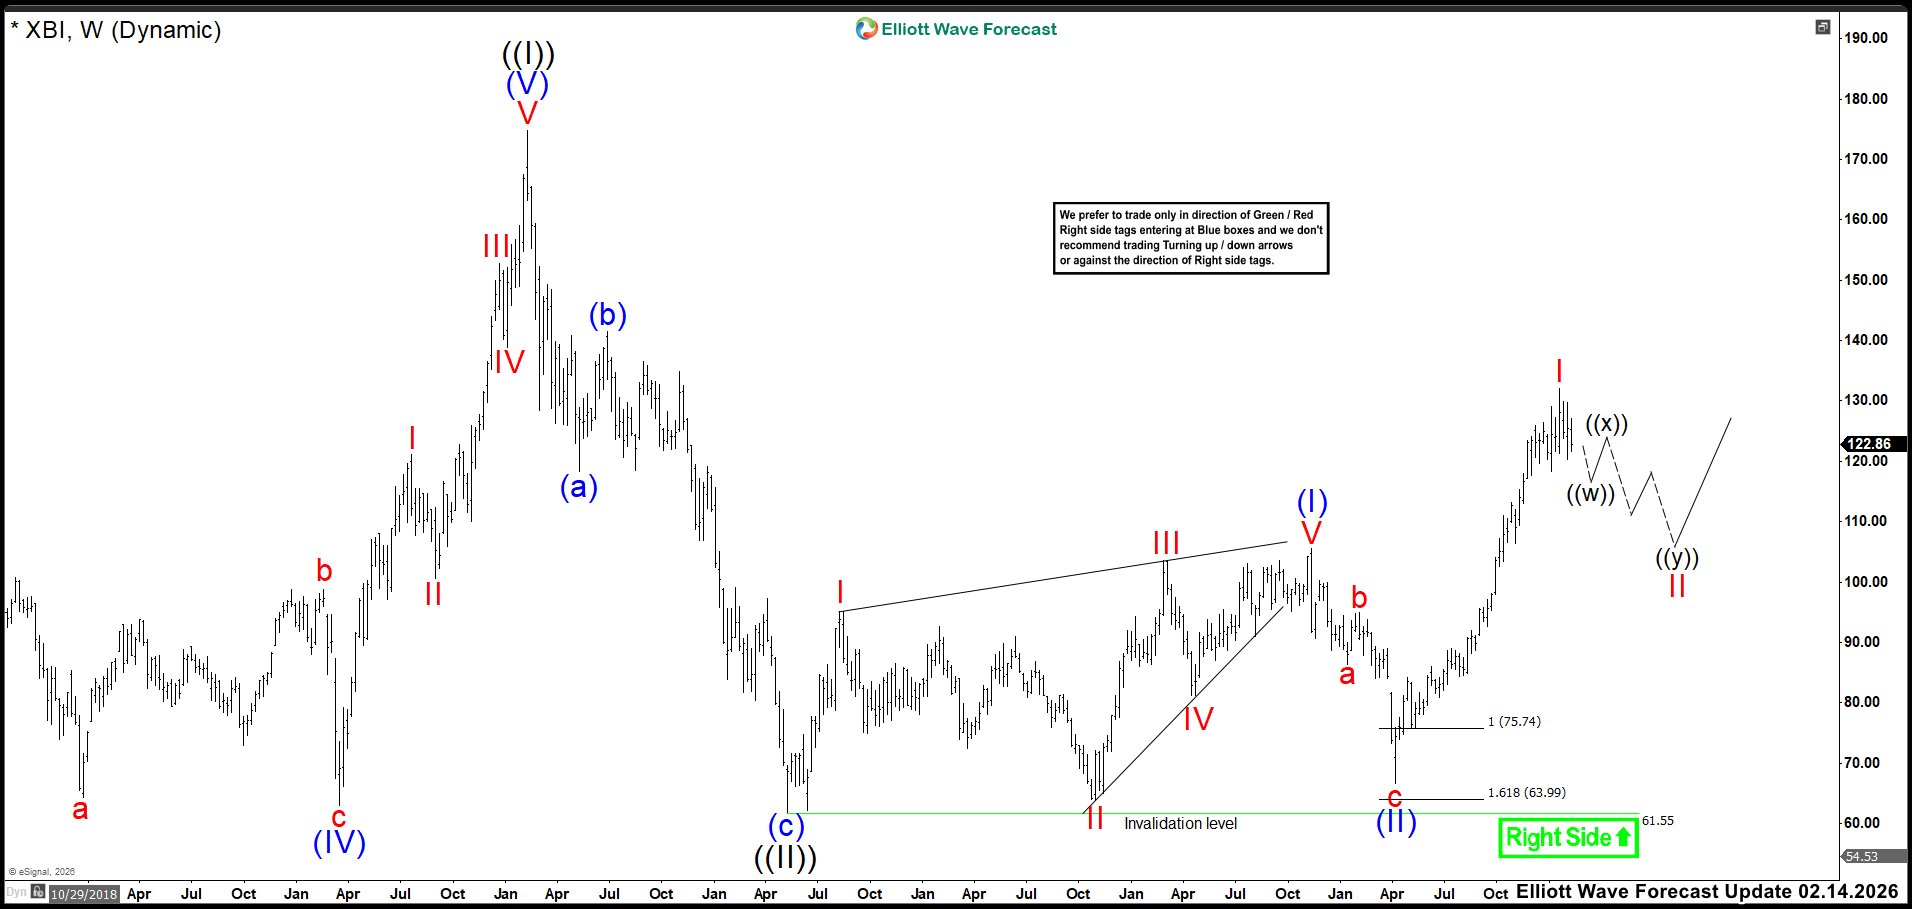
We can see that the impulse from the extreme zone reached 132.00 and now trades near 122.88. This move produced a gain above 62%. Therefore, we believe wave I may have ended. Yes, price could make a marginal high above 132, but caution is better now. Besides, the market should stay choppy until it shows a clear direction. When that move appears, the first break will likely point lower. We expect a double correction as wave II. However, any corrective structure remains possible, including a sharp drop before the bullish trend resumes. For now, we anticipate a correction toward the 107–91 zone. This area may offer new buying opportunities for the next rally in wave III.
Source: https://elliottwave-forecast.c...
면책 조항: 본 게시글에 표현된 견해는 전적으로 작성자의 견해이며 Followme의 공식 입장을 대변하지 않습니다. Followme는 제공된 정보의 정확성, 완전성 또는 신뢰성에 대해 책임을 지지 않으며, 서면으로 명시적으로 언급되지 않는 한 해당 내용을 기반으로 취해진 어떠한 조치에 대해서도 책임을 지지 않습니다.

더 오래된 의견은 없습니다. 소파를 가장 먼저 잡으십시오.