


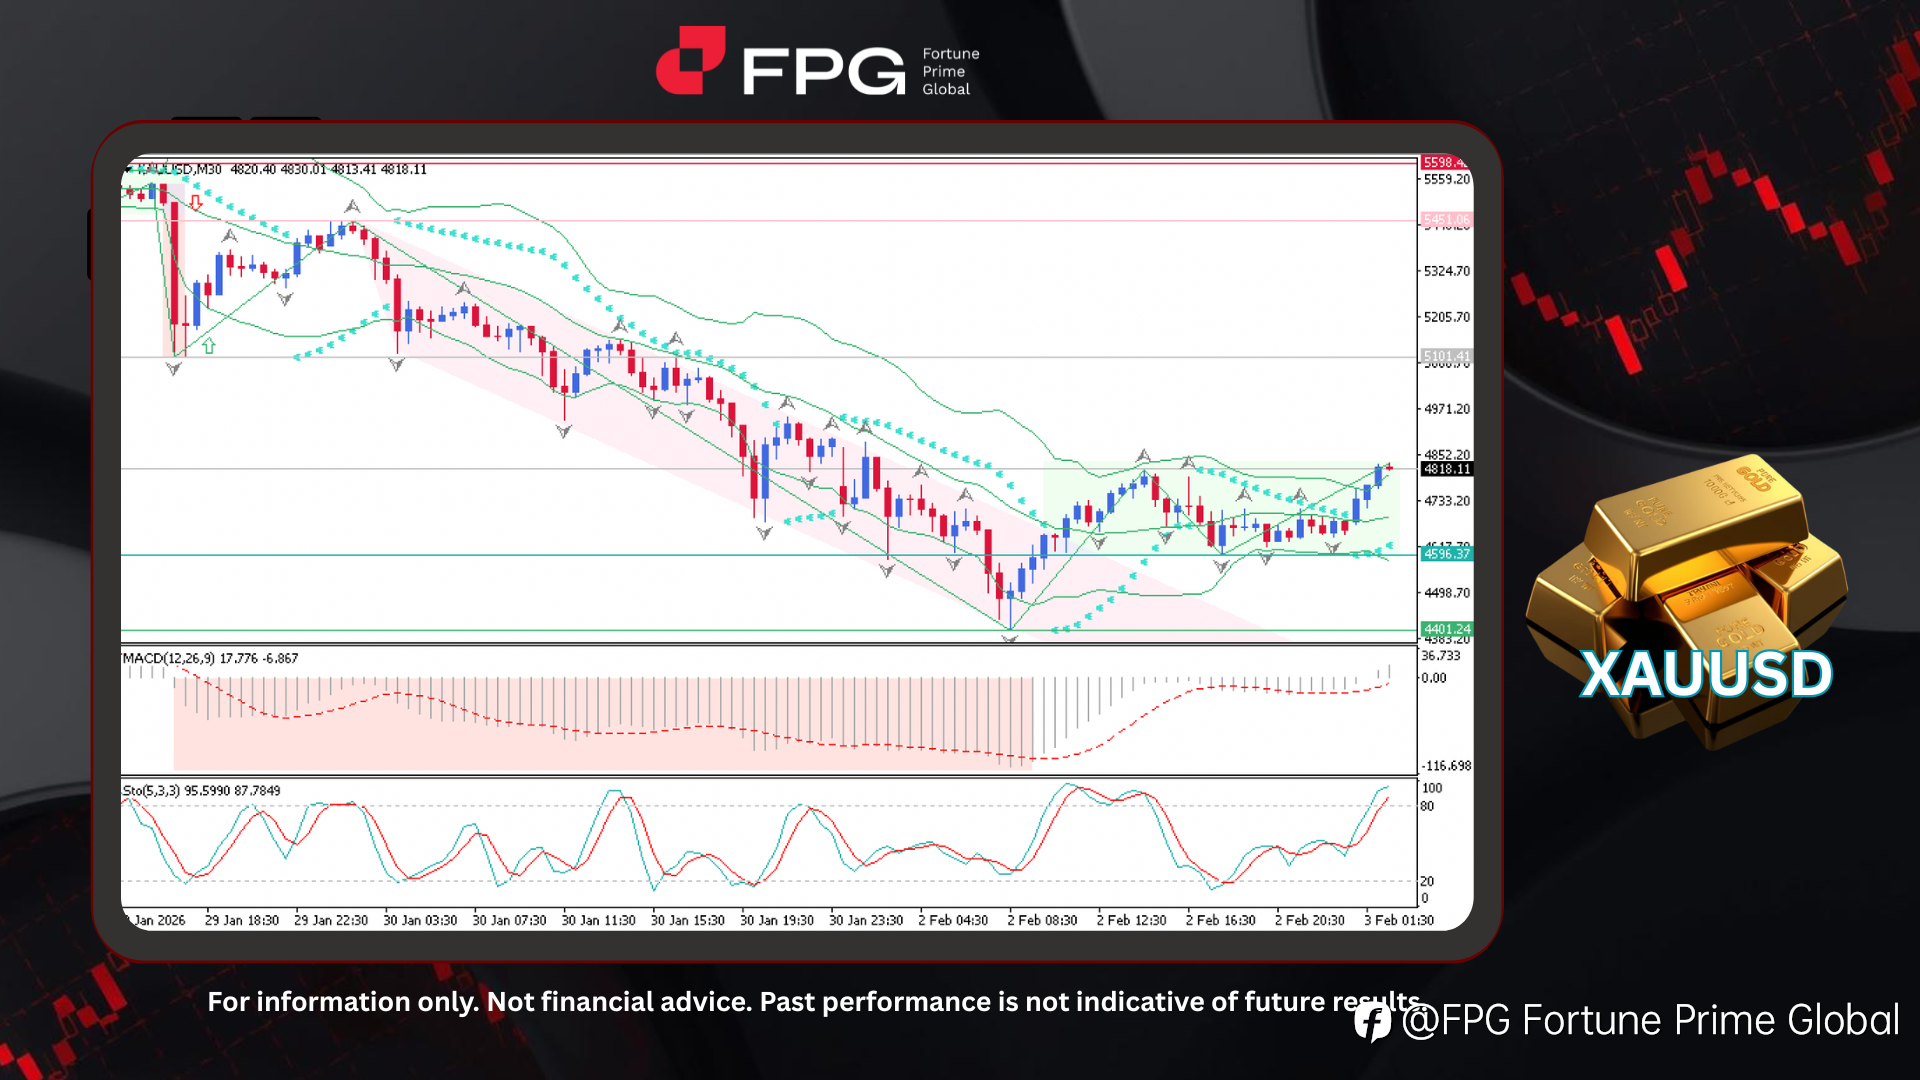
On the M30 timeframe chart of XAUUSD (Gold), price is showing signs of downside exhaustion following a fairly extended bearish trend from the 5451 area down to around 4401, where a clear descending channel pattern was formed. Price action is now showing signs of stabilization, transitioning into a sideways consolidation phase. This ranging structure is currently bounded between the 4852 resistance zone and the 4596 support zone. At present, Gold is trading around 4818, with intraday price swings indicating persistently high volatility.
From an indicator perspective, Bollinger Bands remain relatively wide, reflecting the elevated volatility conditions, while price is fluctuating near the mid-to-upper band, suggesting short-term neutral to slightly bullish pressure within the range. Parabolic SAR dots have begun to appear closer to price, signaling a reduction in strong bearish momentum and a more balanced-bullish market structure. The MACD histogram is recovering from deeply negative territory, with momentum gradually improving, although it has not yet confirmed a strong bullish trend. Meanwhile, the Stochastic Oscillator is oscillating in the upper region, indicating strong short-term buying interest but also warning of potential pullbacks if overbought conditions persist.
Although Gold is currently moving in a sideways manner, overall market volatility remains very high. Such conditions imply that sharp and impulsive price movements can emerge at any moment, even without clear technical confirmation. Upcoming key economic data releases, alongside broader fundamental and geopolitical developments, have the potential to quickly shift market sentiment and drive gold prices aggressively beyond the current range. Traders should therefore remain cautious and flexible, closely monitoring both technical levels and external catalysts.
Market Observation & Strategy Advice
1. Current Position: XAUUSD is trading around 4818 on the M30 timeframe, moving sideways after a prolonged bearish move, with price consolidating inside a high-volatility range.
2. Resistance Zone: Immediate resistance is located around 4852, with a higher intraday supply area near the previous range high.
3. Support Zone: Key support is seen around 4596, followed by a deeper support near the recent swing low at 4401.
4. Indicator Observation: Bollinger Bands remain wide, indicating elevated volatility; MACD is recovering from negative territory, while Stochastic is in the upper region, signaling strong short-term momentum but potential pullback risk.
5. Trading Strategy Suggestions:
- Range Trading: Consider buying near support and selling near resistance while price remains sideways.
- Breakout Confirmation: Wait for a clear breakout above 4852 or below 4596 before following a directional trade.
- Risk Management: Apply strict risk management, as high volatility can trigger sharp and sudden price movements.
Market Performance:
Precious Metals Last Price % Change
XPTUSD 2,155.87 +3.12%
XAGUSD 83.0917 +4.77%
Today’s Key Economic Calendar:
US: Fed Bostic Speech
AU: Building Permits MoM Prel
AU: RBA Interest Rate Decision
AU: RBA Press Conference
FR: Inflation Rate MoM & YoY Prel
US: Fed Barkin Speech
US: JOLTS Job Openings
Risk Disclaimer: This report is for informational purposes only and does not constitute financial advice. Investments involve risks, and past performance does not guarantee future results. Consult your financial advisor for personalized investment strategies.
면책 조항: 본 게시글에 표현된 견해는 전적으로 작성자의 견해이며 Followme의 공식 입장을 대변하지 않습니다. Followme는 제공된 정보의 정확성, 완전성 또는 신뢰성에 대해 책임을 지지 않으며, 서면으로 명시적으로 언급되지 않는 한 해당 내용을 기반으로 취해진 어떠한 조치에 대해서도 책임을 지지 않습니다.

