


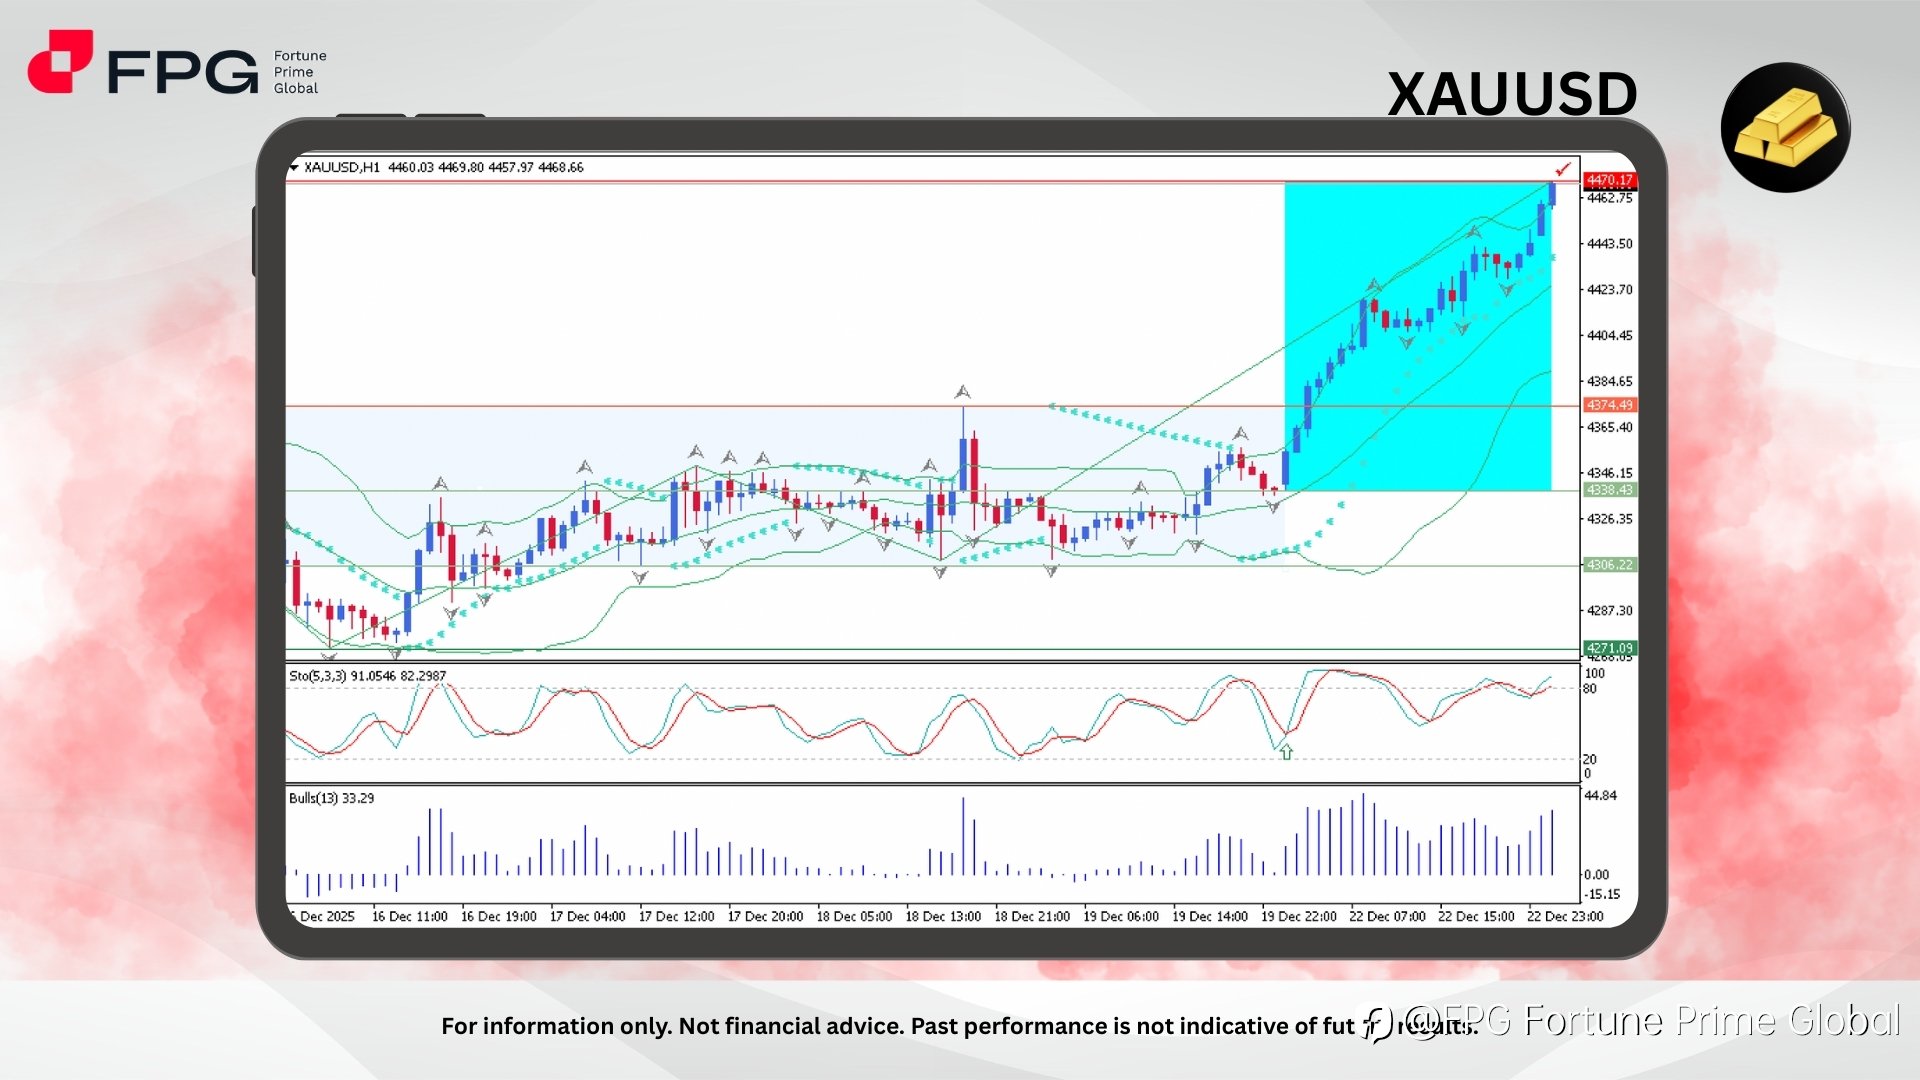
On the XAUUSD (Gold) H1 chart, it is clearly visible that Gold has once again formed a fresh all-time high around the 4470 level. After previously entering a higher sideways consolidation region, Gold experienced strong bullish price action starting from the 4338 area, successfully breaking above the key resistance at 4374 before accelerating sharply toward 4470. Market volatility remains very high, and with bullish momentum still intact, the potential for Gold to print another new ATH in the near term remains open.
From a technical indicator perspective, price is currently moving well above its dynamic moving average support, confirming a strong bullish trend structure. The Bollinger Bands are expanding, signaling increased volatility and strong directional momentum rather than exhaustion. The Stochastic Oscillator is hovering in the overbought region, reflecting aggressive buying pressure; however, it has not shown a clear bearish crossover yet, suggesting momentum is still supported. Meanwhile, bullish momentum indicators continue to print positive readings, indicating that buyers remain firmly in control despite the elevated price levels.
Gold has now entered a new, higher structural phase that is strongly supported by fundamental factors, particularly the ongoing global weakening of the US dollar. One of the recent catalysts adding to safe-haven demand is rising geopolitical tension, including developments involving the US and Venezuela. Traders should remain cautious and attentive to all fundamental drivers that may impact Gold prices, especially during high-impact economic data releases, central bank communications, and geopolitical headlines, as these can further amplify volatility.
Market Observation & Strategy Advice
1. Current Position: The current price is around 4469, remaining highly volatile with price action still biased toward the bullish side.
2. Resistance: The immediate resistance is the psychological zone around 4470–4500, where short-term profit-taking may occur. A clean breakout above this area could open the door for further price discovery to higher levels.
3. Support: Nearest support is located around 4435–4410, aligned with minor pullback lows and dynamic trend support. A stronger support zone sits lower at 4374–4338, which previously acted as a key breakout and demand area.
4. Indicator: Momentum indicators remain bullish, with price trading well above dynamic moving average support. Bollinger Bands are expanding, confirming high volatility and strong trend continuation. The Stochastic Oscillator is in the overbought region, signaling strong buying pressure, though short-term pullbacks remain possible.
5. Trading Strategy Suggestions:
- Buy on pullback: Look for bullish price action near the 4410–4435 support zone to rejoin the uptrend.
- Breakout continuation: Consider buy entries on a confirmed H1 close above 4470 with strong momentum.
- Risk management: Use tight risk control, as volatility is elevated and sudden corrections can occur near ATH levels.
Market Performance:
Precious Metals Last Price % Change
XPTUSD 2,152.18 +0.75%
XAGUSD 69.1716 +0.16%
Today’s Key Economic Calendar:
AU: RBA Meeting Minutes
US: Durable Goods Orders MoM
US: GDP Growth Rate QoQ 2nd Est
CA: GDP MoM & GDP MoM Prel
US: Industrial Production MoM
Risk Disclaimer: This report is for informational purposes only and does not constitute financial advice. Investments involve risks, and past performance does not guarantee future results. Consult your financial advisor for personalized investment strategies.
면책 조항: 본 게시글에 표현된 견해는 전적으로 작성자의 견해이며 Followme의 공식 입장을 대변하지 않습니다. Followme는 제공된 정보의 정확성, 완전성 또는 신뢰성에 대해 책임을 지지 않으며, 서면으로 명시적으로 언급되지 않는 한 해당 내용을 기반으로 취해진 어떠한 조치에 대해서도 책임을 지지 않습니다.

