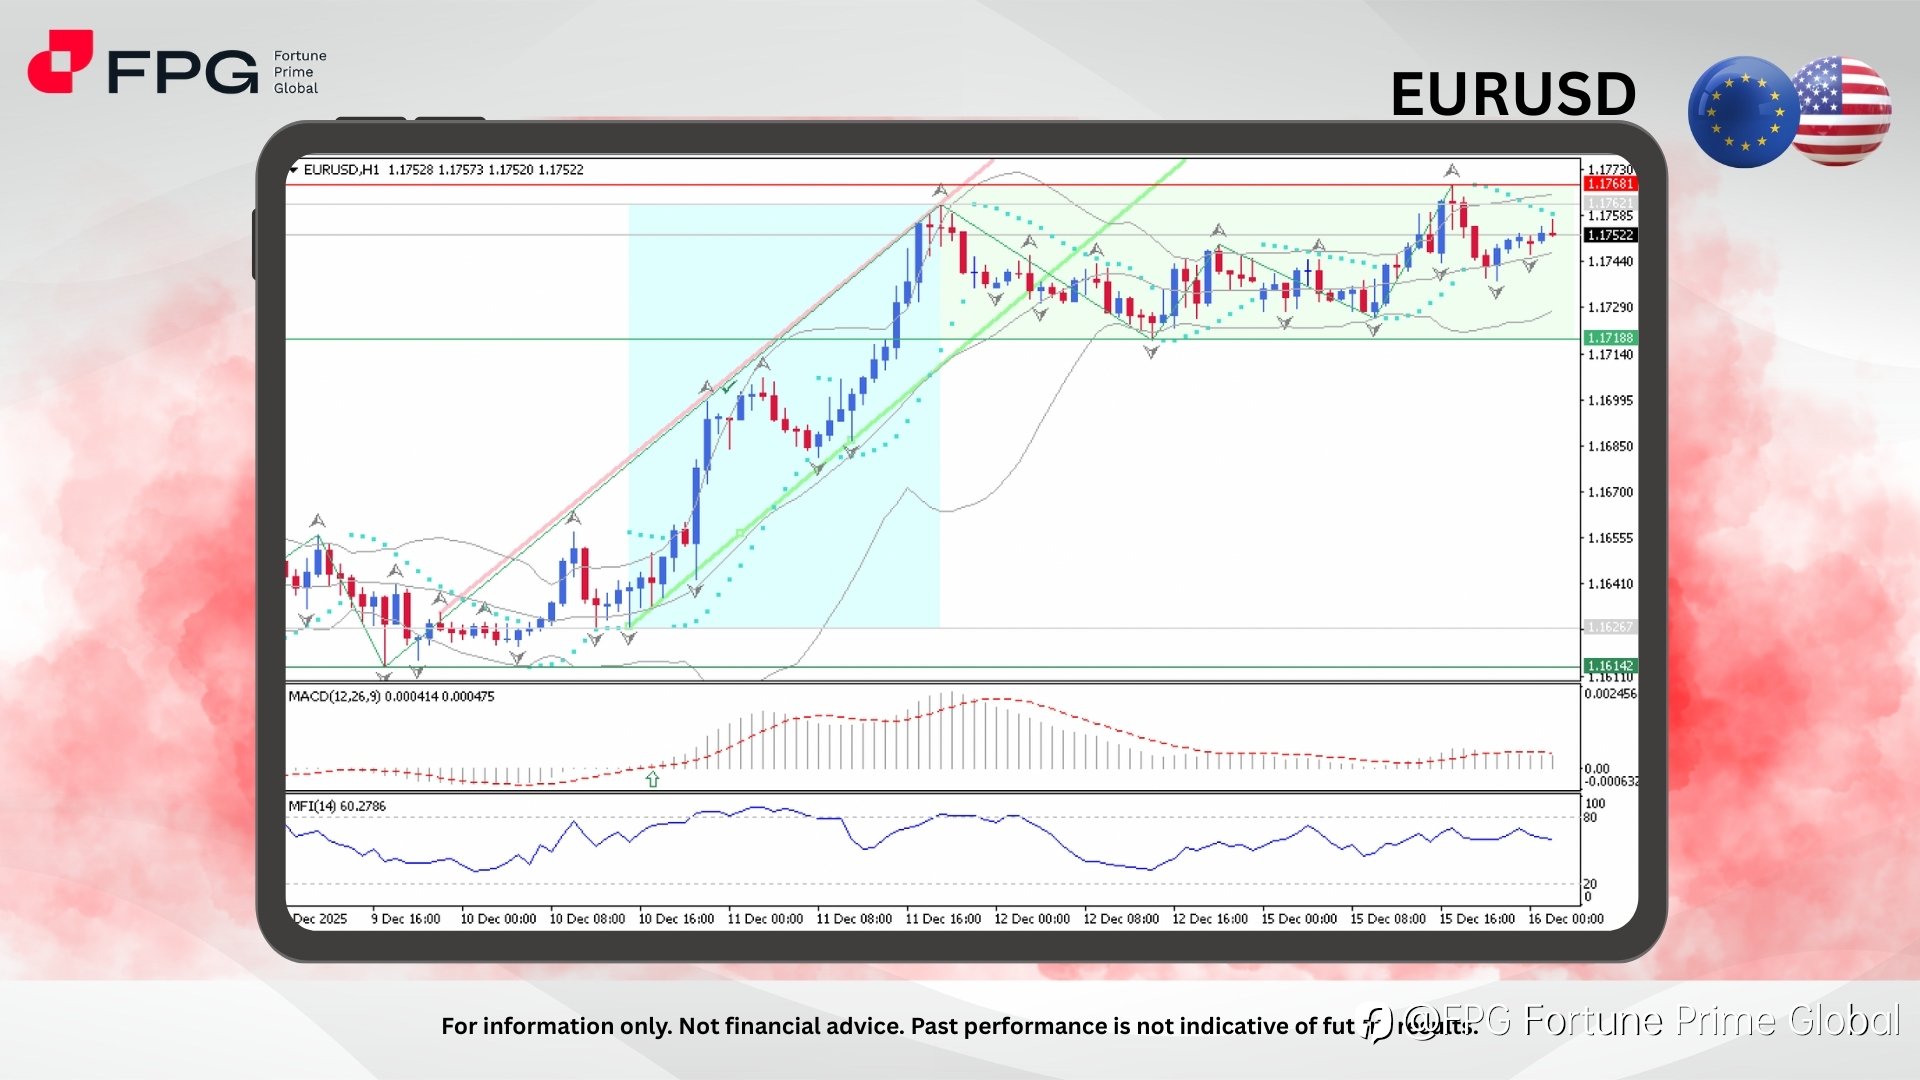
On the EURUSD H1 chart, the pair is currently entering a sideways consolidation phase, highlighted by the green zone. This consolidation follows a previously strong and impulsive bullish rally shown in the blue zone, where price surged aggressively from 1.1627 to 1.1762. After reaching that peak, bullish momentum began to cool, and EURUSD started oscillating within a relatively flat channel structure. The current price is trading around 1.1752, suggesting the market is digesting prior gains while awaiting fresh directional catalysts.
Price is currently trading near the upper Bollinger Band but no longer expanding, indicating volatility compression after the bullish impulse. Parabolic SAR has started to cluster closer to price, reflecting a transition from trending conditions into consolidation. MACD (12,26,9) remains above the zero line, confirming the broader bullish bias, but histogram bars are flattening, signaling slowing momentum rather than continuation. Money Flow Index (14) is holding around 60, showing neutral-to-moderate buying pressure without overbought conditions, reinforcing the idea of balance between buyers and sellers during this sideways phase.
The current sideways movement likely reflects a temporary equilibrium between bullish and bearish forces after the strong rally. From a fundamental perspective, this condition can also be interpreted as a waiting zone, where market participants pause before committing to more aggressive positions. Historically, such consolidation phases often precede sharp directional moves, especially around high-impact economic releases. Traders should remain alert and closely monitor today’s key economic events for potential volatility expansion.
Market Observation & Strategy Advice
1. Current Position: EURUSD is currently trading around 1.1752, moving sideways within a narrow range after a strong bullish run, indicating short-term indecision.
2. Resistance Zone: Key resistance is located near 1.1768 – 1.1773, which represents a supply zone where previous bullish attempts were rejected. A clean breakout above this zone could revive bullish continuation.
3. Support Zone: Immediate support is seen around 1.1719 – 1.1720, aligning with the lower boundary of the consolidation range.
4. Indicators: MACD remains positive but flat, MFI stays in neutral territory, and Parabolic SAR reflects consolidation — all confirming a non-trending, range-bound condition.
5. Trading Strategy Suggestions:
- Range trading setup: Buy near 1.1720 and sell near 1.1768 while price remains within consolidation, using tight risk management.
- Bullish breakout strategy: Buy on a confirmed H1 breakout above 1.1773, targeting 1.1810 – 1.1850.
- Risk management: Reduce position size ahead of major economic releases due to potential volatility spikes.
Market Performance:
Forex Last Price % Change
USD/JPY 155.06 −0.09%
GBP/USD 1.3371 +0.01%
Today’s Key Economic Calendar:
AU: Westpac Consumer Confidence Change
UK: Unemployment Rate
DE: HCOB Manufacturing PMI Flash
UK: S&P Global Manufacturing & Services PMI Flash
EU: Balance of Trade
DE: ZEW Economic Sentiment Index
US: Building Permits Prel
US: Housing Starts
US: Non Farm Payrolls
US: Retail Sales MoM
US: Unemployment Rate
Risk Disclaimer: This report is for informational purposes only and does not constitute financial advice. Investments involve risks, and past performance does not guarantee future results. Consult your financial advisor for personalized investment strategies.
면책 조항: 본 게시글에 표현된 견해는 전적으로 작성자의 견해이며 Followme의 공식 입장을 대변하지 않습니다. Followme는 제공된 정보의 정확성, 완전성 또는 신뢰성에 대해 책임을 지지 않으며, 서면으로 명시적으로 언급되지 않는 한 해당 내용을 기반으로 취해진 어떠한 조치에 대해서도 책임을 지지 않습니다.

더 오래된 의견은 없습니다. 소파를 가장 먼저 잡으십시오.