


Platinum (PL) has developed a strong five‑wave nesting impulse from the March 2020 low, reinforcing the view that the right side of the market remains higher. In this article, we present the latest long‑term Elliott Wave outlook.
Platinum (PL) Monthly Elliott Wave Chart
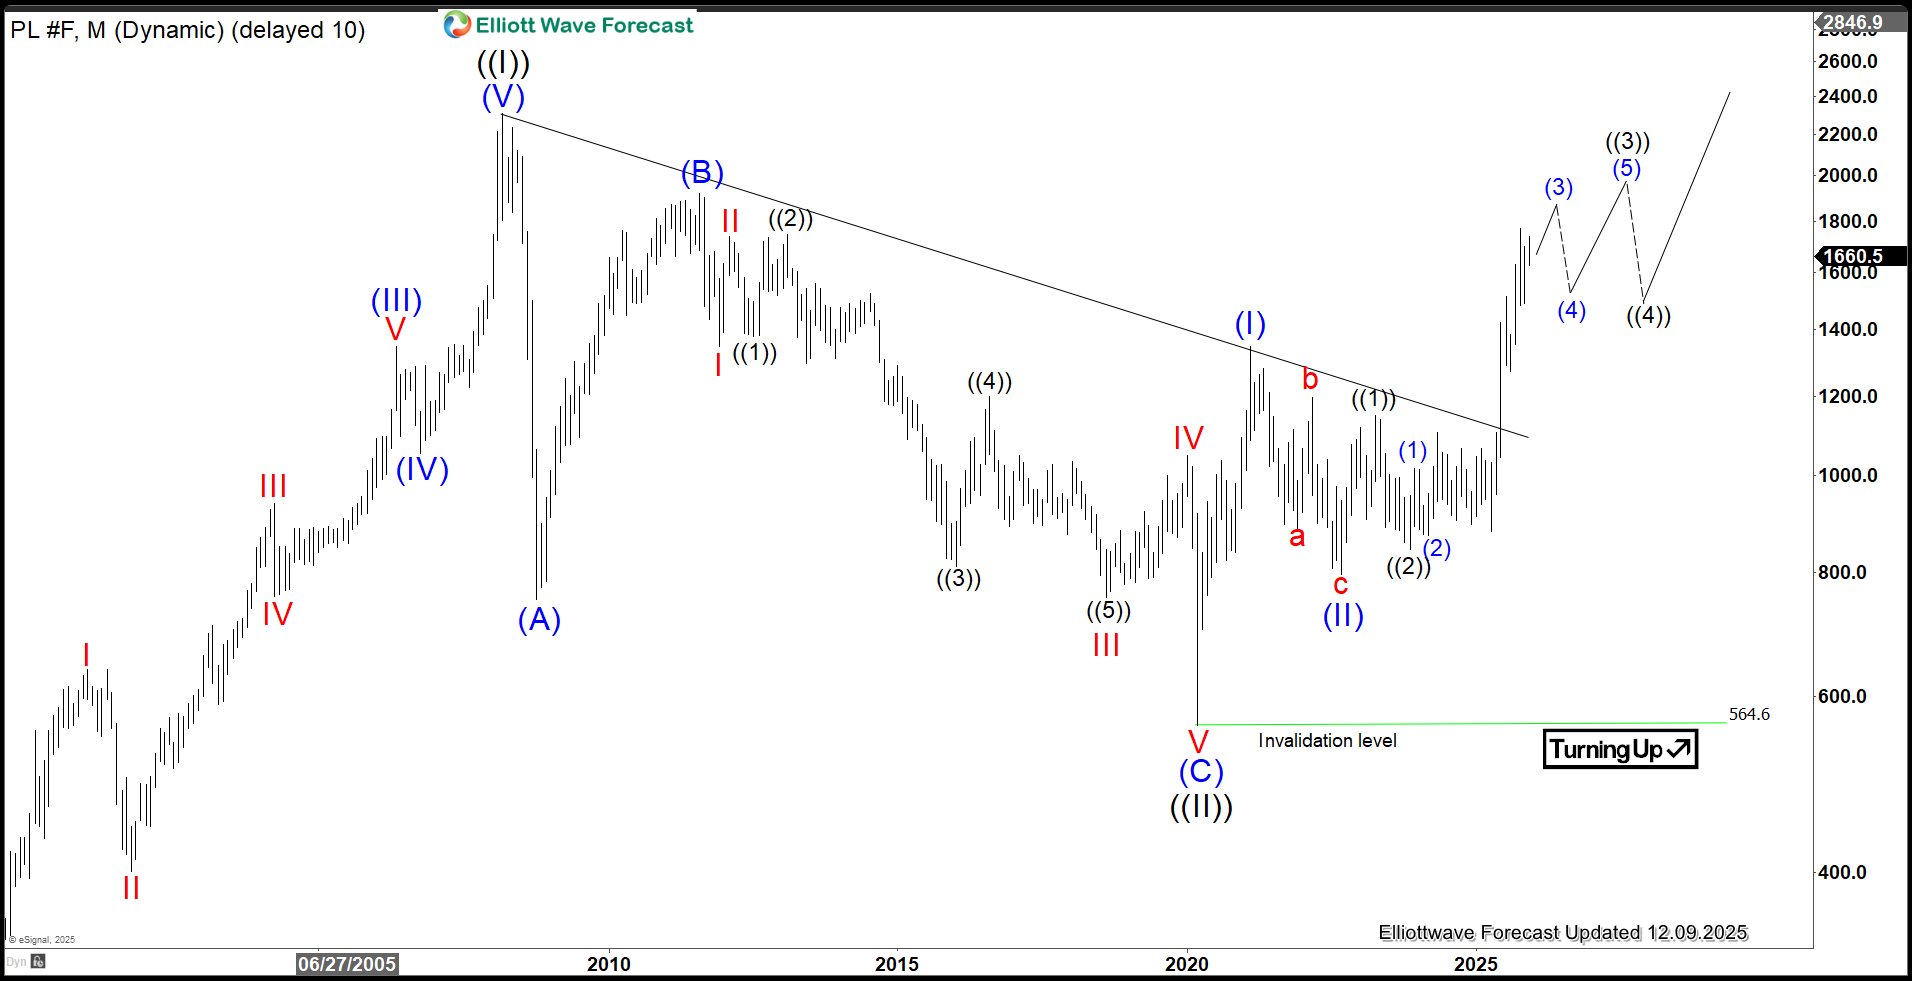
The monthly Platinum chart highlights a strong nesting impulse that began after the March 2020 low at 564.6. We have identified this low as wave ((II)) of the Grand Super Cycle. From that point, the metal resumed its advance in wave ((III)). Within this structure, wave (I) of ((III)) completed at 1348.2, followed by a corrective pullback in wave (II) that ended at 796.8. Platinum then began nesting higher within wave (III), which is expected to unfold through a sequence of fourth and fifth waves before completion. As long as price remains above 564.6, the broader outlook continues to favor further upside.
Platinum (PL) Daily Elliott Wave Chart
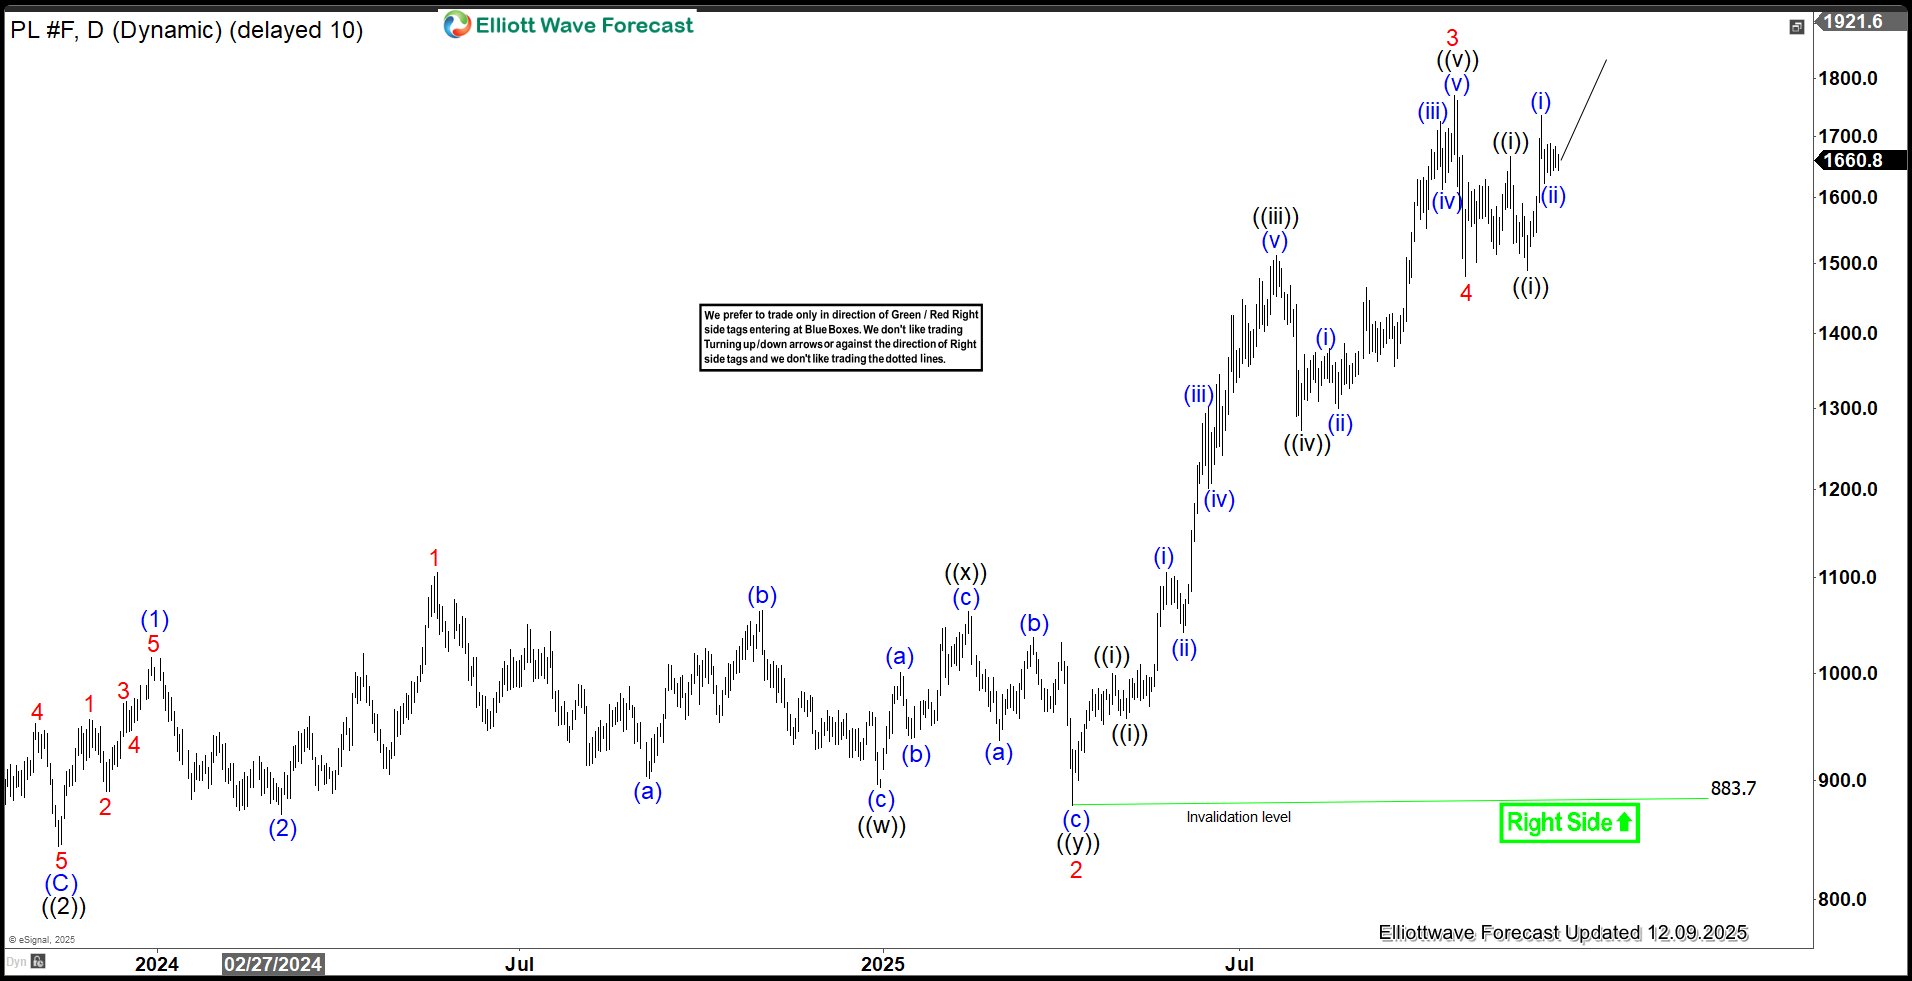
The daily Platinum chart indicates that the wave ((2)) pullback concluded at 843.1. From this low, the metal began nesting higher. Wave (1) completed at 1105 and the subsequent wave (2) pullback ended at 883.7. The advance continued with wave (3) reaching 1770. A corrective wave (4) followed which settled at 1481.2. In the near term, as long as price action holds above 883.7, any pullback should find support within a 3, 7, or 11-swing sequence, setting the stage for further upside.
면책 조항: 본 게시글에 표현된 견해는 전적으로 작성자의 견해이며 Followme의 공식 입장을 대변하지 않습니다. Followme는 제공된 정보의 정확성, 완전성 또는 신뢰성에 대해 책임을 지지 않으며, 서면으로 명시적으로 언급되지 않는 한 해당 내용을 기반으로 취해진 어떠한 조치에 대해서도 책임을 지지 않습니다.

