We previously mapped BlackRock's (NYSE: BLK) bullish weekly path earlier this year. Today, our analysis continues with the Elliott Wave structure behind its rally from the 2022 low. This update highlights the next high-probability buying opportunity emerging for the stock.
Elliott Wave Analysis
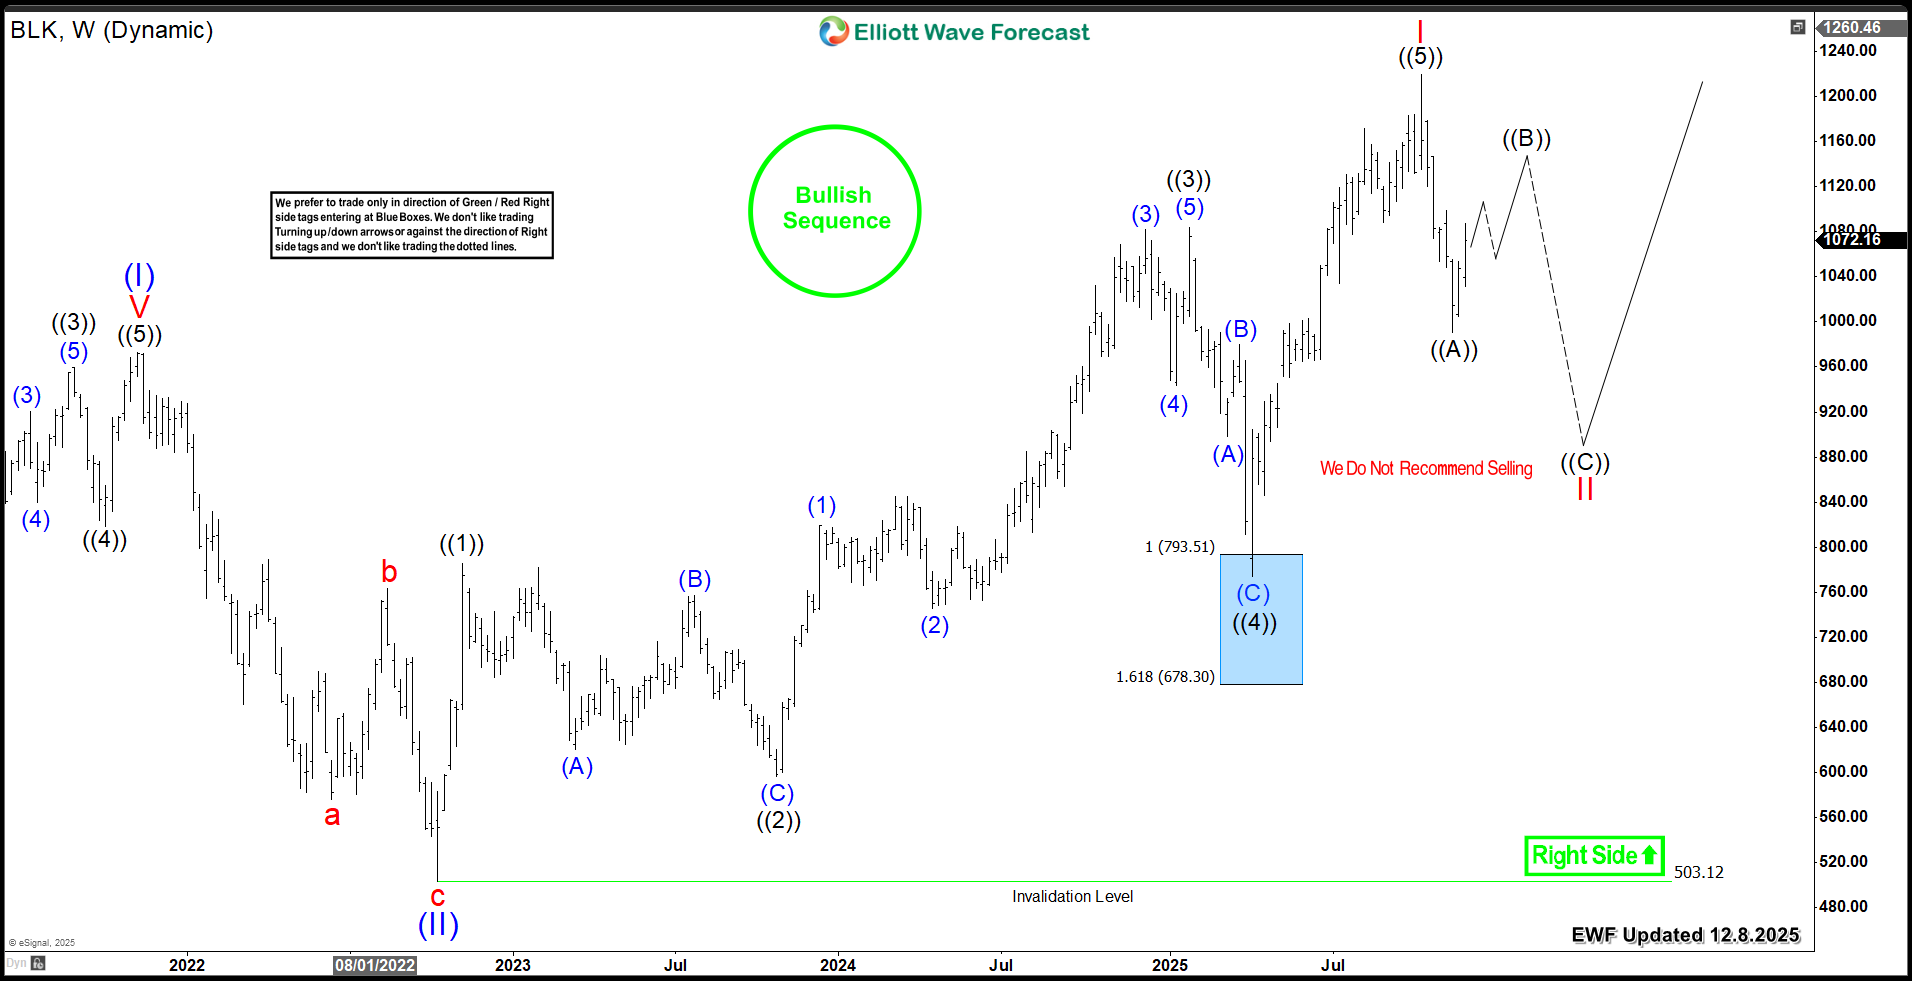
BlackRock's April 2025 correction marked wave ((4)), finding support in the Blue Box area $793-$678 . The subsequent rally to new highs then completed wave ((5)). This suggests the cycle from the 2022 low is mature and likely finished.
Currently, BLK holds above the April low of $773. This does not rule out a nesting pattern, but a larger wave II correction may have already begun. Consequently, as long as price stays below the October high of $1219, the path favors another leg down next year.
This larger correction could push BLK below $1,000. The 38.2% - 50% Fibonacci retracement zone sits at $946 - $861. This area will provide a strategic, diamond-level opportunity to position for the next uptrend, with a longer-term target toward $1500.
BlackRock (BLK) Weekly Chart 12.8.2025
Conclusion
BlackRock's larger-degree bullish cycle remains firmly intact. Therefore, investors should continue targeting buying opportunities within weekly and daily pullbacks. Utilize our Elliott Wave strategy for precise entry timing. Specifically, establish positions after a 3, 7, or 11-swing correction completes. Additionally, our proprietary Blue Box system highlights high-probability zones with pinpoint accuracy. As a result, this disciplined method gives traders the clarity and confidence to catch the next bullish leg.
면책 조항: 본 게시글에 표현된 견해는 전적으로 작성자의 견해이며 Followme의 공식 입장을 대변하지 않습니다. Followme는 제공된 정보의 정확성, 완전성 또는 신뢰성에 대해 책임을 지지 않으며, 서면으로 명시적으로 언급되지 않는 한 해당 내용을 기반으로 취해진 어떠한 조치에 대해서도 책임을 지지 않습니다.

더 오래된 의견은 없습니다. 소파를 가장 먼저 잡으십시오.