


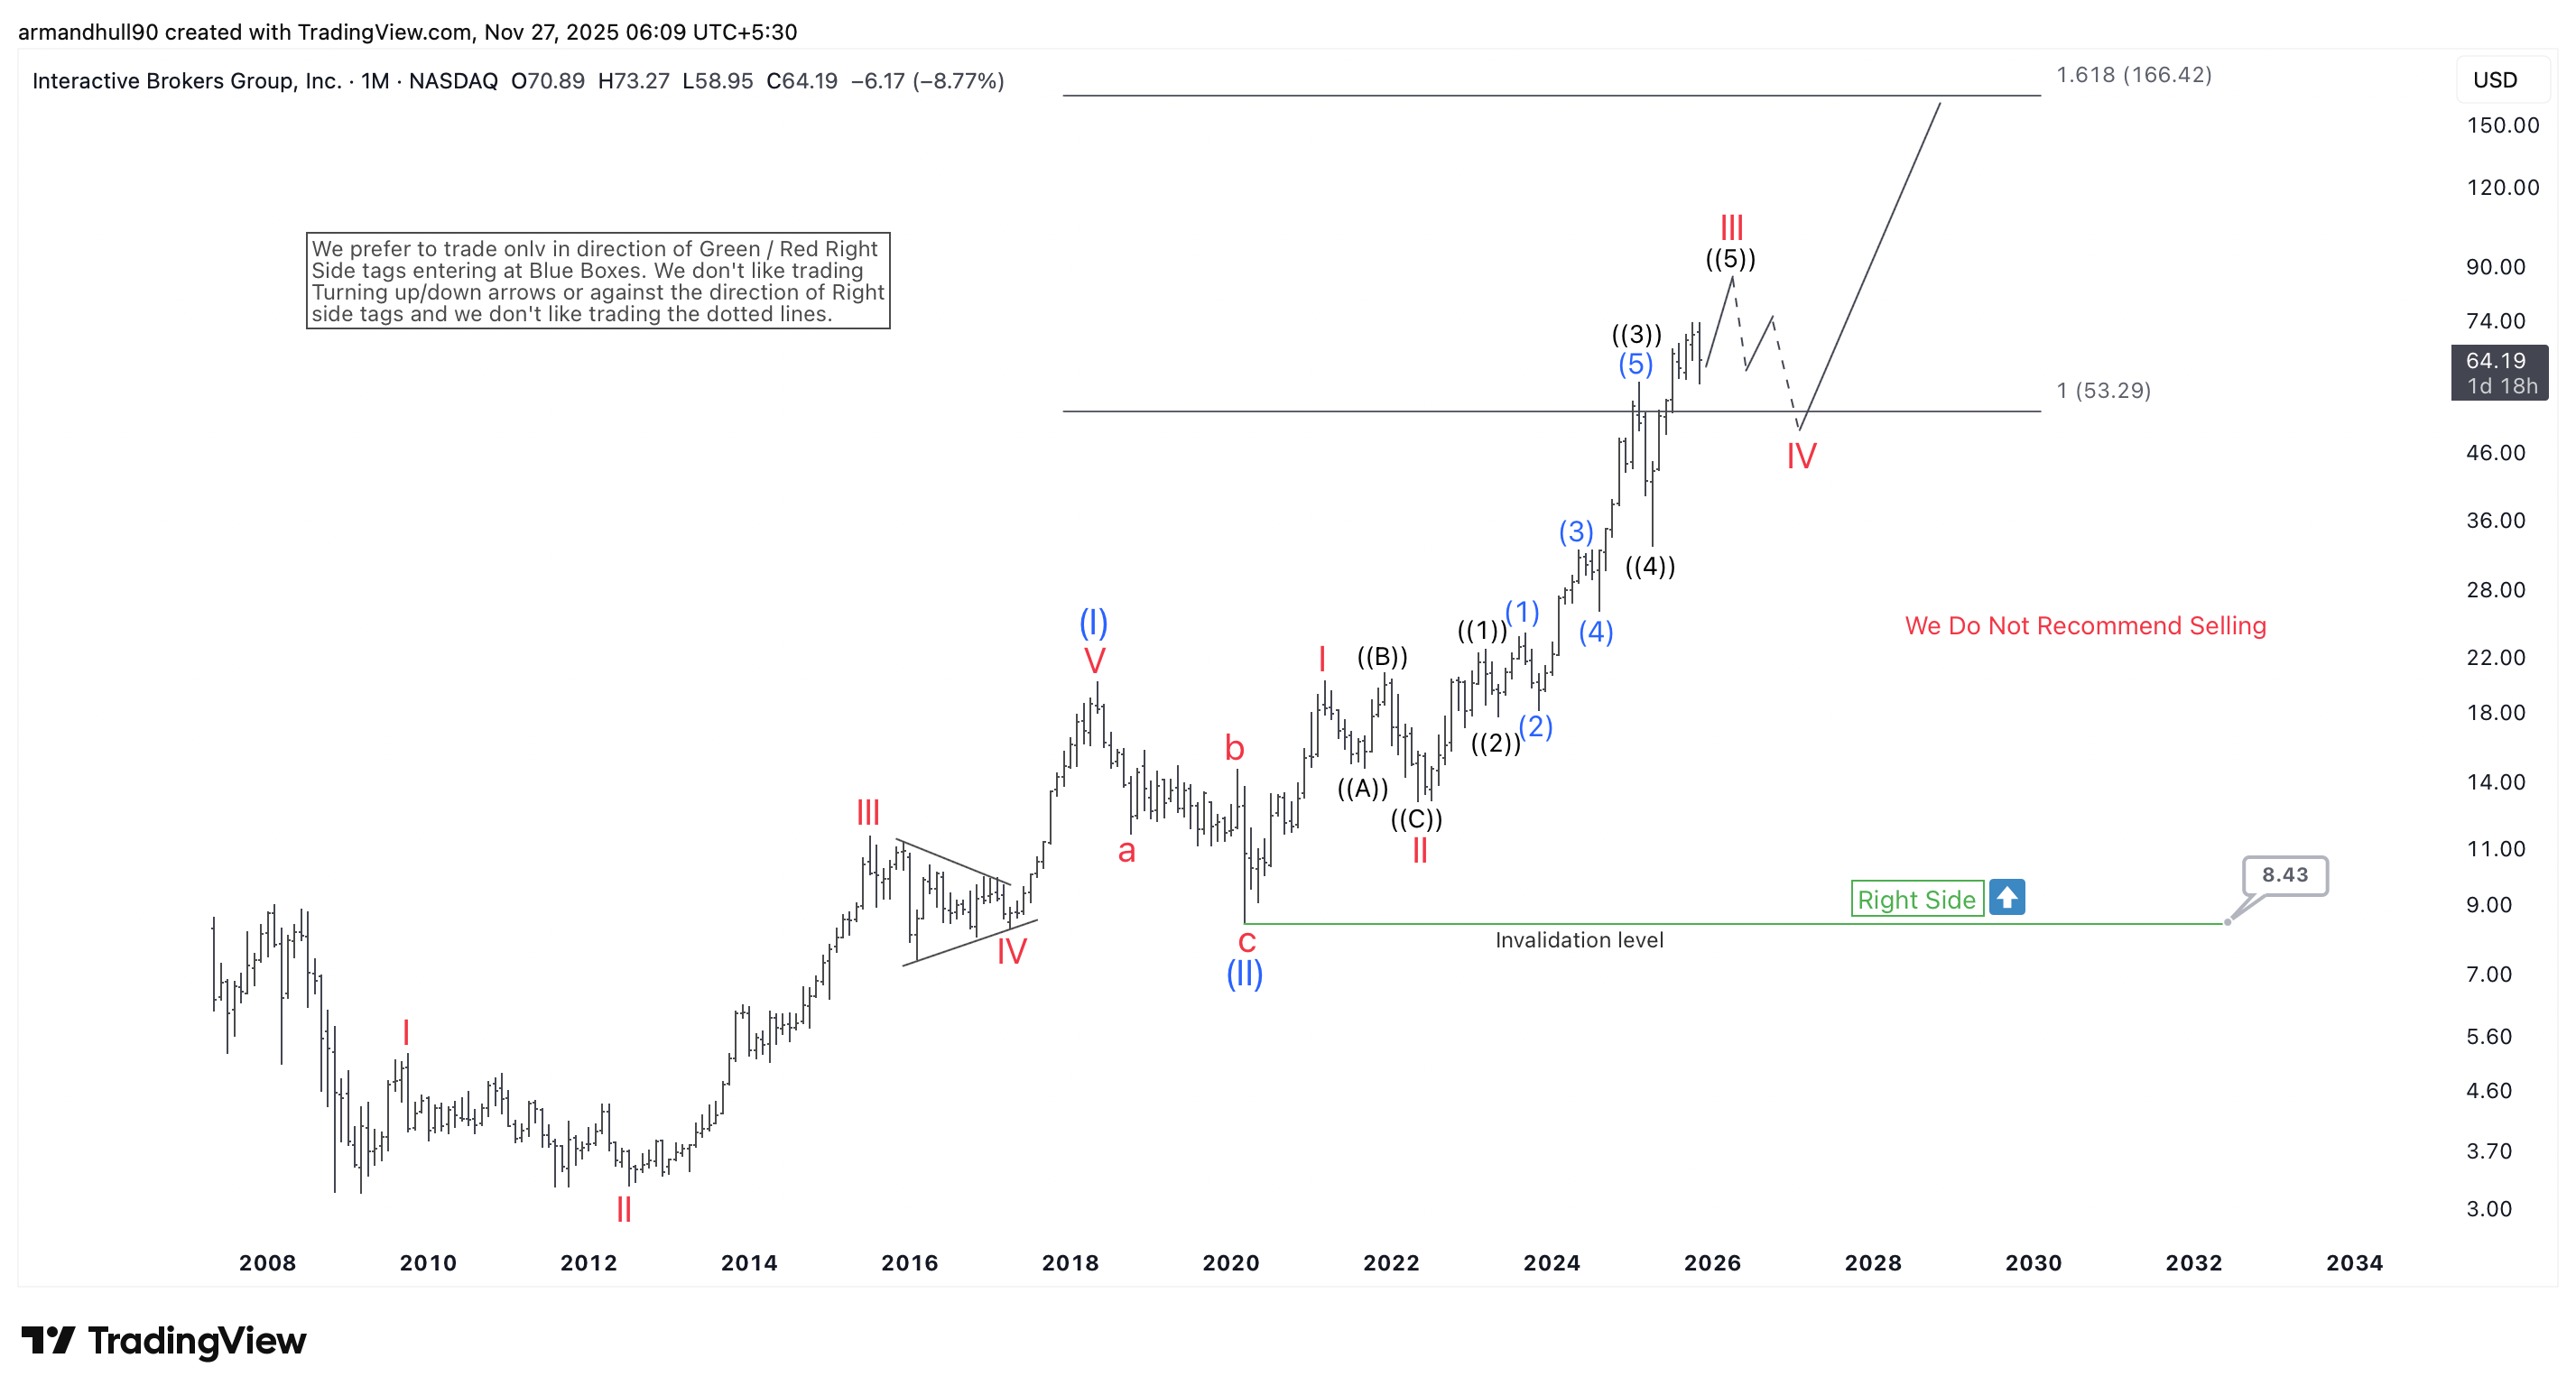
IBKR advances in a powerful Wave III structure, with Fibonacci projections pointing toward 86 in the near term and a long-term target of 166 USD—while maintaining bullish validation above 8.43.
Interactive Brokers Group (NASDAQ: IBKR) continues to maintain a resilient bullish structure, supported by a clear Elliott Wave progression. The stock has recently completed a significant corrective phase and has now entered what appears to be an impulsive and potentially explosive bullish cycle. Understanding this wave structure is essential for traders looking for opportunities, especially as price action unfolds toward higher Fibonacci targets.
Wave Counts Suggest IBKR Is in a Powerful Wave III
After finishing wave (II) at the 8.43 USD level, the stock started wave (III), which represents a higher-degree impulsive phase. Wave (III) often delivers strong and extended moves, and IBKR is showing signs of that behaviour. The structure now indicates that the stock is advancing inside wave III of (III). This segment is typically the most powerful portion of the impulse. Third waves tend to show steep momentum and often exceed early price projections.
Within wave III, IBKR appears to be finishing wave ((5)). This final leg is expected to push toward 86 USD. If momentum continues to build, the move could extend above this level. A break of resistance would further validate the strength of wave III and could open the door to higher prices.
Potential Pullback and Long-Term Bullish Target
Once wave III concludes, the stock should begin wave IV. This structure usually unfolds in 3, 7, or 11 swings. A controlled pullback during this phase may offer a fresh buying opportunity. The bullish scenario remains valid as long as wave IV holds above 8.43 USD.
The long-term Fibonacci projection for wave V of (III) sits near 166 USD. This target is derived from the 1.618 Fibonacci extension of earlier impulse waves. The alignment between price structure and Fibonacci measurements supports the higher target. If price follows the expected path, IBKR could deliver significant upside in the coming months and years.
Conclusion
IBKR maintains a firm bullish outlook under the Elliott Wave framework. Wave ((5)) inside wave III is nearing its end, and a wave IV pullback may soon set up another buying opportunity. The key level to watch remains 8.43 USD. As long as price holds above this support, IBKR could advance toward 86 USD first and eventually aim for the 166 USD Fibonacci target. The setup continues to favor the bulls, supported by a clear structure and strong trend momentum.
면책 조항: 본 게시글에 표현된 견해는 전적으로 작성자의 견해이며 Followme의 공식 입장을 대변하지 않습니다. Followme는 제공된 정보의 정확성, 완전성 또는 신뢰성에 대해 책임을 지지 않으며, 서면으로 명시적으로 언급되지 않는 한 해당 내용을 기반으로 취해진 어떠한 조치에 대해서도 책임을 지지 않습니다.

- 끝 -