


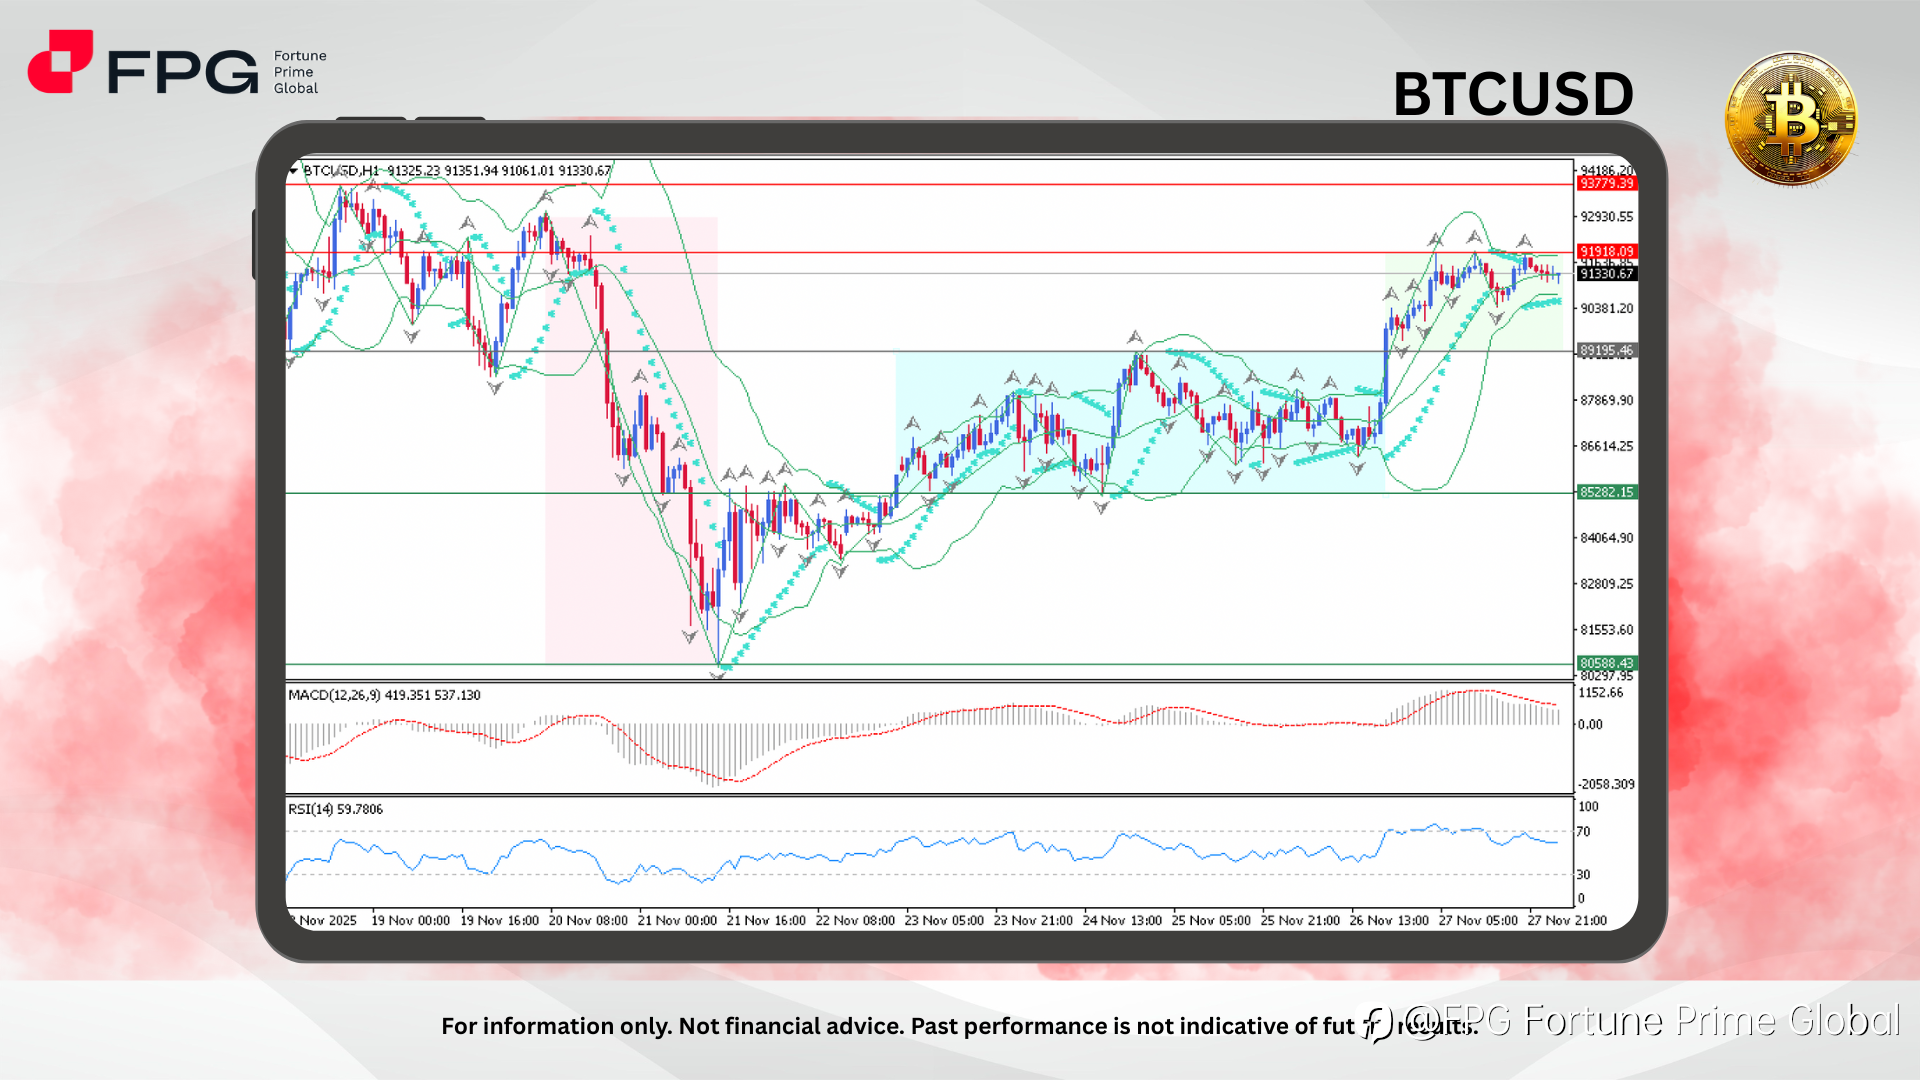
On the H1 chart, BTCUSD is showing sustained bullish momentum after rebounding strongly from the demand zone around 80588, forming a steady ascending structure. Price has climbed and is now consolidating near the upper boundary around 91330, showing signs of bullish exhaustion yet holding above key support. The consolidating candles near resistance indicate indecision, suggesting either continuation with bullish breakout or potential pullback to retest near-term support levels.
Price action is currently moving above the middle Bollinger Band, showing sustained bullish structure but weakening volatility as the bands are gradually narrowing. Parabolic SAR dots remain below price, signaling bullish continuation, although recent slowing in upward momentum indicates possible consolidation. The sequence of higher highs and higher lows remains intact, suggesting buyers still dominate short-term sentiment.
MACD continues to remain above the zero-line, showing bullish momentum, though histogram bars are decreasing, signaling weakening strength and possible early divergence. RSI stands around 59, indicating neutral-to-bullish momentum but not yet overbought, giving room for further upside unless rejection occurs from key resistance. Price is sitting near a major resistance, making this zone a decision point for either breakout or corrective drop.
Market Observation & Strategy Advice
1. Current Position: BTCUSD is currently trading around 91330, consolidating near a major resistance after a strong bullish run, indicating a critical decision area for the next directional move.
2. Resistance Zone: Immediate resistance is located at 91918, aligned with recent rejection highs. A sustained breakout above this zone may open the door toward the next resistance region around 93779 and potentially 94186.
3. Support Zone: Initial support lies at 89195. A deeper support can be found at 85282, marking the previous swing low and a strong demand zone.
4. Indicators: MACD remains bullish but shows signs of momentum fading with thinning histogram bars. RSI at 59 suggests moderate bullish pressure without entering overbought territory. Parabolic SAR and Bollinger Bands still support bullish bias but show early signs of slowing volatility.
5. Trading Strategy Suggestions:
- Bullish Breakout Setup: Buy stop above 91950 with targets at 93779. Place stop-loss below 90400.
- Pullback Entry Setup: Buy limit around 89200–89400 targeting 90500 and 91350, with stop-loss below 88200.
- Correction Scenario: If price rejects 91380 and breaks below 89195, consider short positions targeting 85282, with stop-loss above 90200.
Market Performance:
Crypto Last Price % Change
ETHUSD 3,011.1 −0.12%
SOLUSD 140.77 −0.04%
Today’s Key Economic Calendar:
JP: Unemployment Rate
JP: Industrial Production MoM Prel
JP: Retail Sales YoY
DE: Retail Sales MoM & YoY
FR: Inflation Rate YoY Prel
DE: Inflation Rate YoY Prel
CA: GDP Growth Rate Annualized & QoQ
Risk Disclaimer: This report is for informational purposes only and does not constitute financial advice. Investments involve risks, and past performance does not guarantee future results. Consult your financial advisor for personalized investment strategies.
면책 조항: 본 게시글에 표현된 견해는 전적으로 작성자의 견해이며 Followme의 공식 입장을 대변하지 않습니다. Followme는 제공된 정보의 정확성, 완전성 또는 신뢰성에 대해 책임을 지지 않으며, 서면으로 명시적으로 언급되지 않는 한 해당 내용을 기반으로 취해진 어떠한 조치에 대해서도 책임을 지지 않습니다.

