



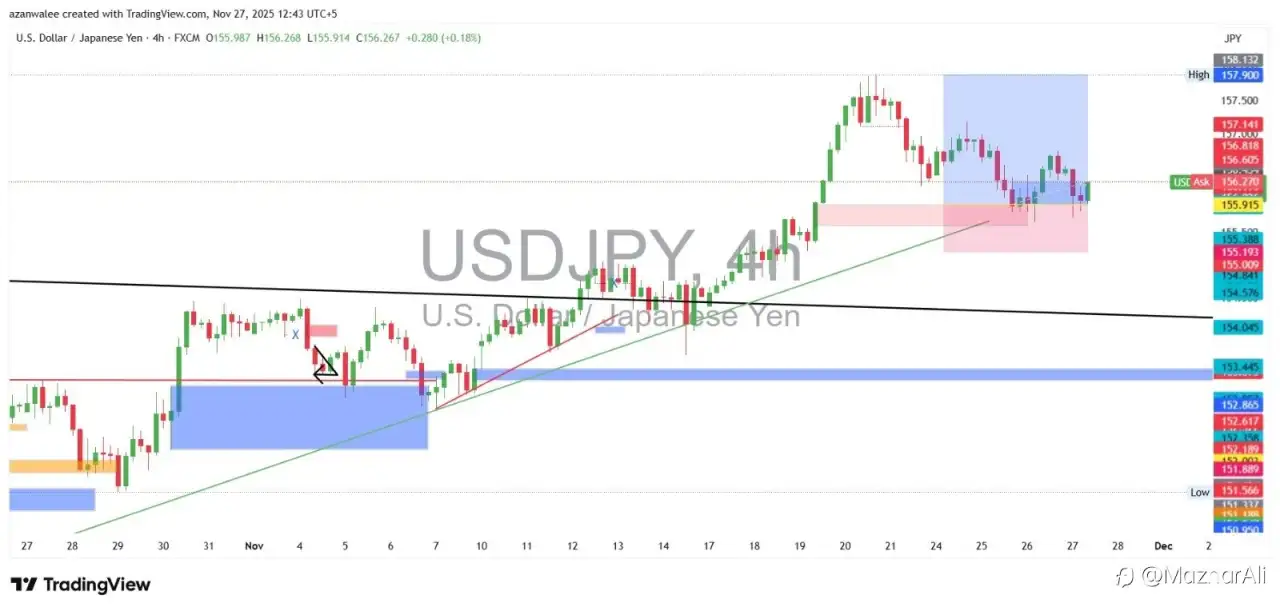
Price has been riding a strong bullish trend for weeks, and the chart still reflects that broader upside structure—but momentum has clearly cooled off. After tapping the 158.10–157.90 zone, buyers lost steam and the pair slid into a corrective phase.
The current pullback has dropped into a demand region around 156.00–155.80, which aligns with the rising trendline drawn from early November. The market has reacted here before, and you can see buyers attempting to defend it again. As long as price holds above 155.90, bulls keep a slight structural advantage.
However, that last swing high failed to continue with the same energy—classic sign of exhaustion. If price loses this demand zone, the next pocket of liquidity sits deeper near 154.05, a level that previously acted as strong support.
On the upside, the 157.40–157.80 zone remains the key supply cap. A clean break above it reopens the path back toward the recent highs.
In short:
• Buyers are trying to stabilize on support, but momentum isn’t fully convincing.
• Losing the trendline 155.80 opens the door to a sharper correction.
• Holding above it keeps the bullish structure alive.
The pair is at a decision point, and this compression usually leads to a strong push in one direction.
편집됨
면책 조항: 본 게시글에 표현된 견해는 전적으로 작성자의 견해이며 Followme의 공식 입장을 대변하지 않습니다. Followme는 제공된 정보의 정확성, 완전성 또는 신뢰성에 대해 책임을 지지 않으며, 서면으로 명시적으로 언급되지 않는 한 해당 내용을 기반으로 취해진 어떠한 조치에 대해서도 책임을 지지 않습니다.


- 끝 -