


Coinbase (NASDAQ: COIN) has plummeted 46% from its peak. This sharp decline mirrors a broader sell-off gripping both crypto and equity markets. The convergence of these downturns creates a critical technical juncture for the stock.
Today, we will dissect the Elliott Wave correction currently in progress. Our analysis establishes a clear potential path for the stock over the coming months, providing a strategic roadmap for traders navigating this volatility..
Elliott Wave Analysis
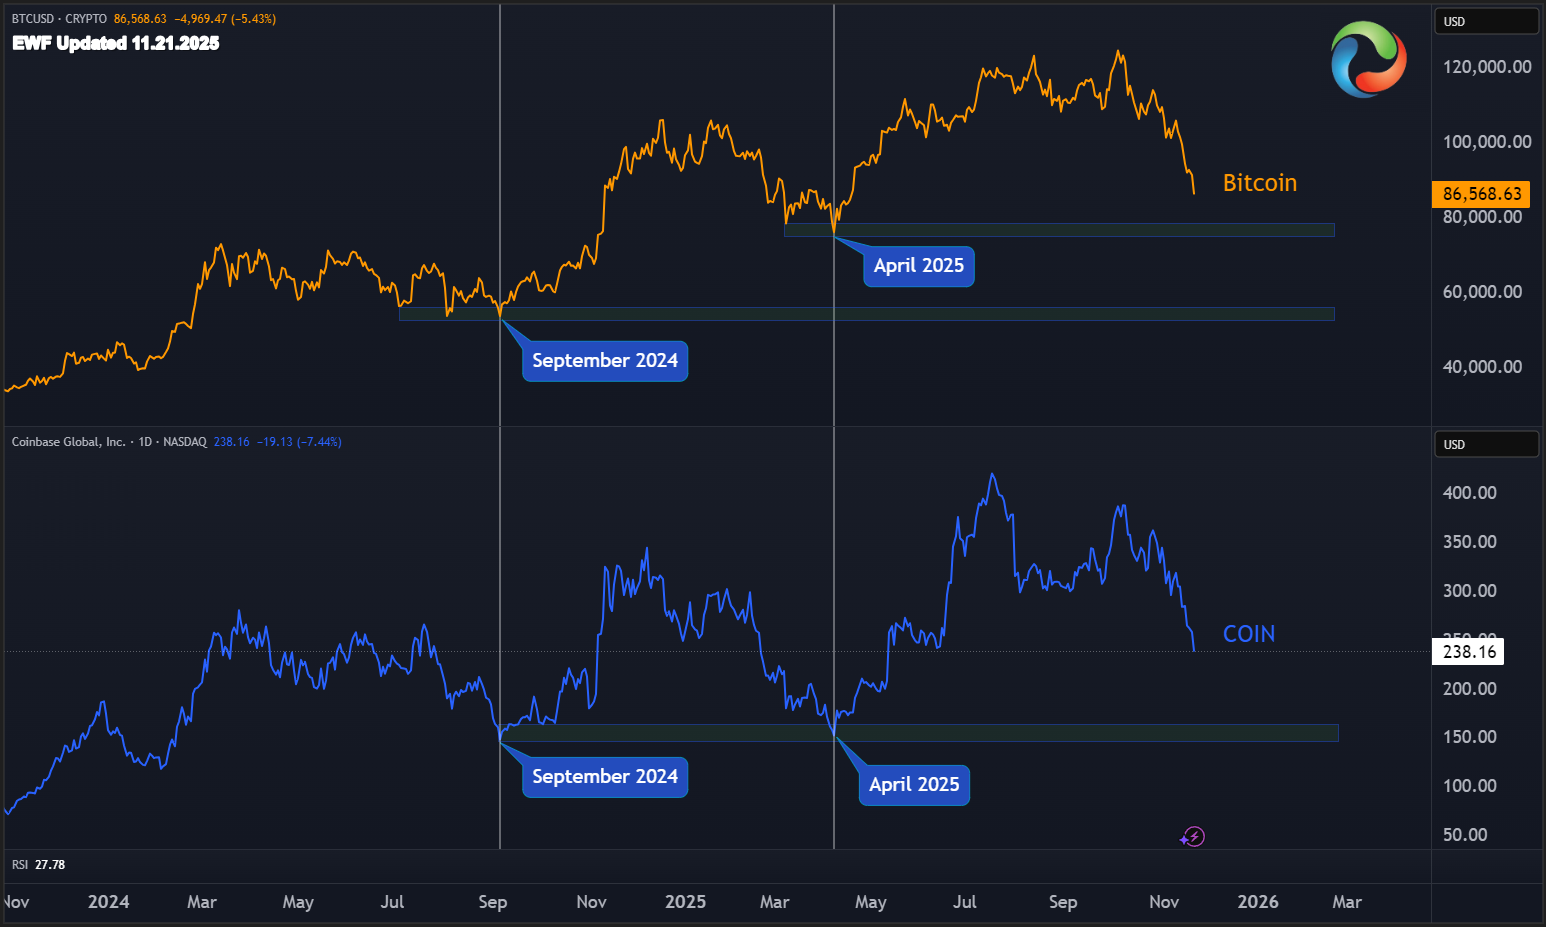
A clear positive correlation links Bitcoin and COIN. Both assets consistently share major highs and lows. Consequently, we expect this relationship to continue during the current downturn. Furthermore, Bitcoin now approaches its April 2025 low. It will likely retest the September 2024 low next. Therefore, COIN should follow this same path. This alignment targets the $150 area for Coinbase.
Coinbase Vs Bitcoin
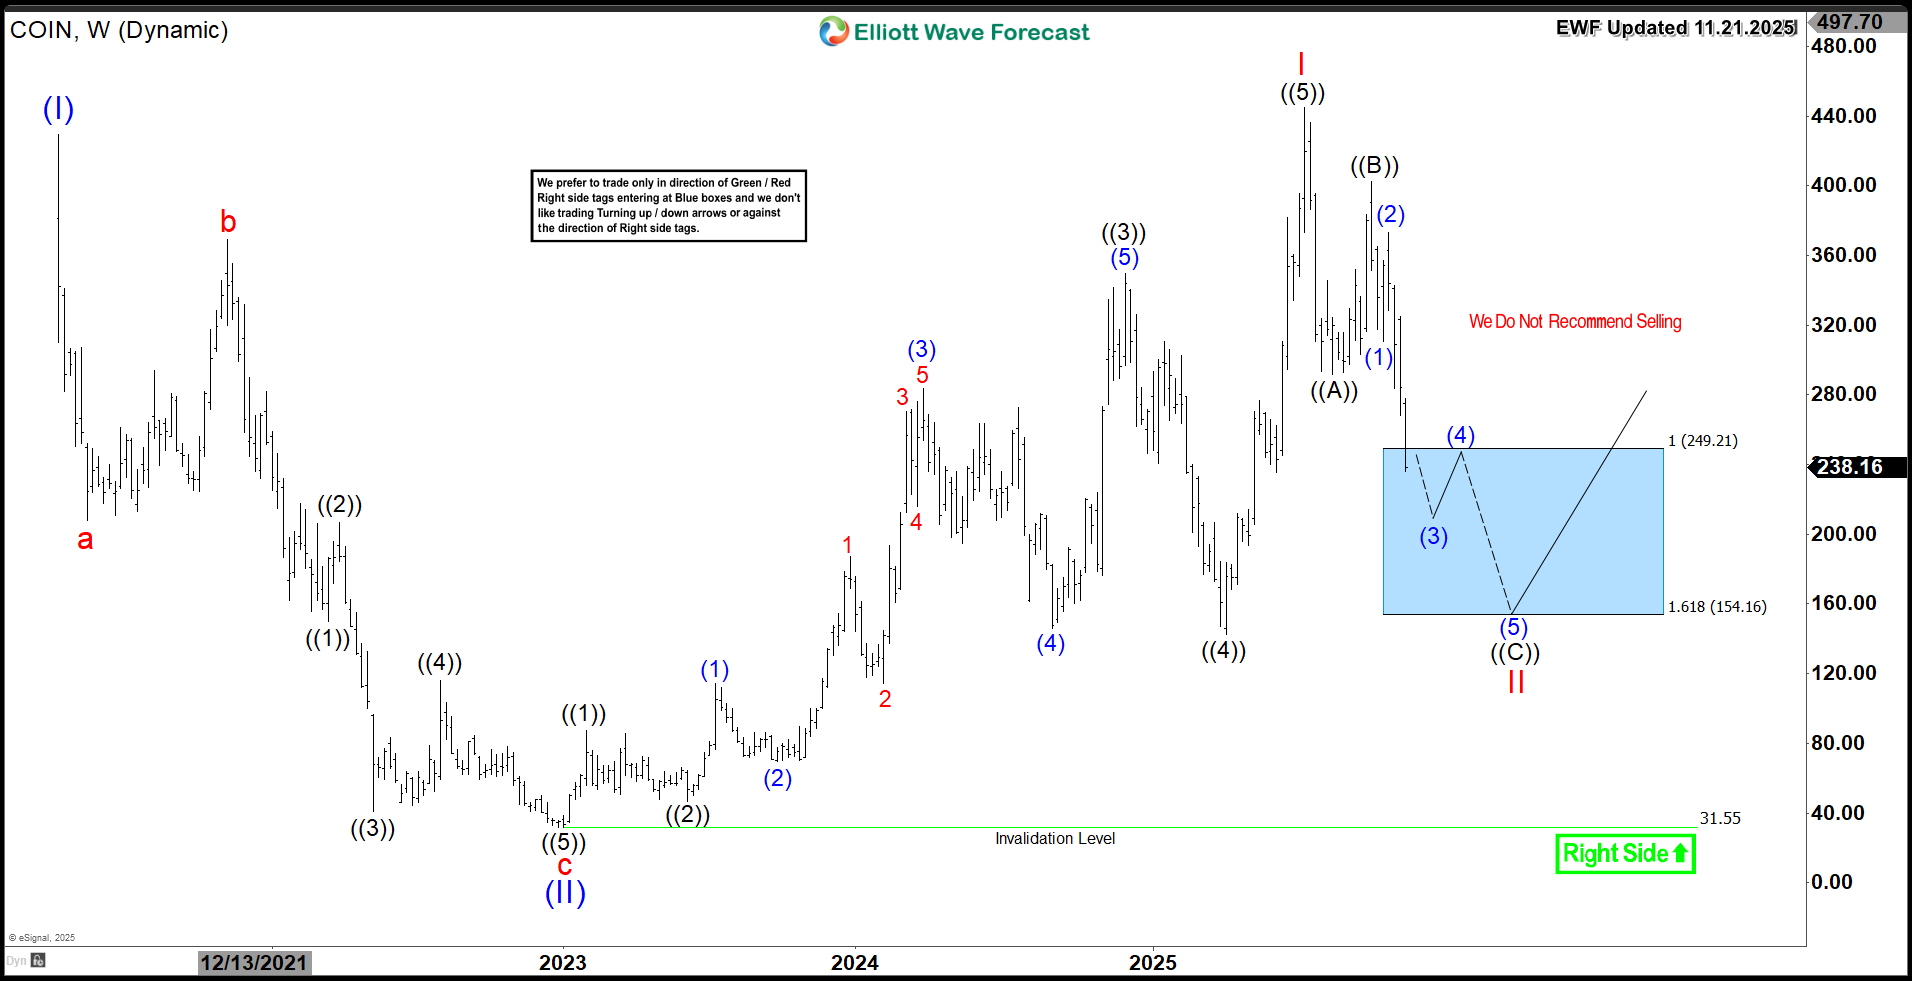
The COIN weekly chart shows a higher high sequence after July's all-time highs. Since then, a larger degree pullback has started. This correction aims to correct the five-wave advance from the January 2023 low.
The pullback is unfolding as a three-wave zigzag structure. Wave ((A)) ended at $291 on August 20, 2025. Subsequently, wave ((B)) bounced to $402 by October 10, 2025. Currently, wave ((C)) is progressing and has entered the $249 equal legs area.
However, Bitcoin's suggested correction implies further COIN weakness. Therefore, we expect a move toward the $154 Fibonacci 1.618 extension into next year. This projected low should complete wave II and setup the next major rally.
COIN Weekly Chart 11.21.2025
Conclusion
COIN is undergoing a necessary weekly correction, setting up a strategic investment opportunity for next year. You can precisely time your entry into this and other trades using our Elliott Wave strategy. Our methodology identifies optimal entries after a 3, 7, or 11-swing correction completes. Furthermore, our proprietary Blue Box system pinpoints high-probability reversal zones with clarity and confidence.
면책 조항: 본 게시글에 표현된 견해는 전적으로 작성자의 견해이며 Followme의 공식 입장을 대변하지 않습니다. Followme는 제공된 정보의 정확성, 완전성 또는 신뢰성에 대해 책임을 지지 않으며, 서면으로 명시적으로 언급되지 않는 한 해당 내용을 기반으로 취해진 어떠한 조치에 대해서도 책임을 지지 않습니다.

