



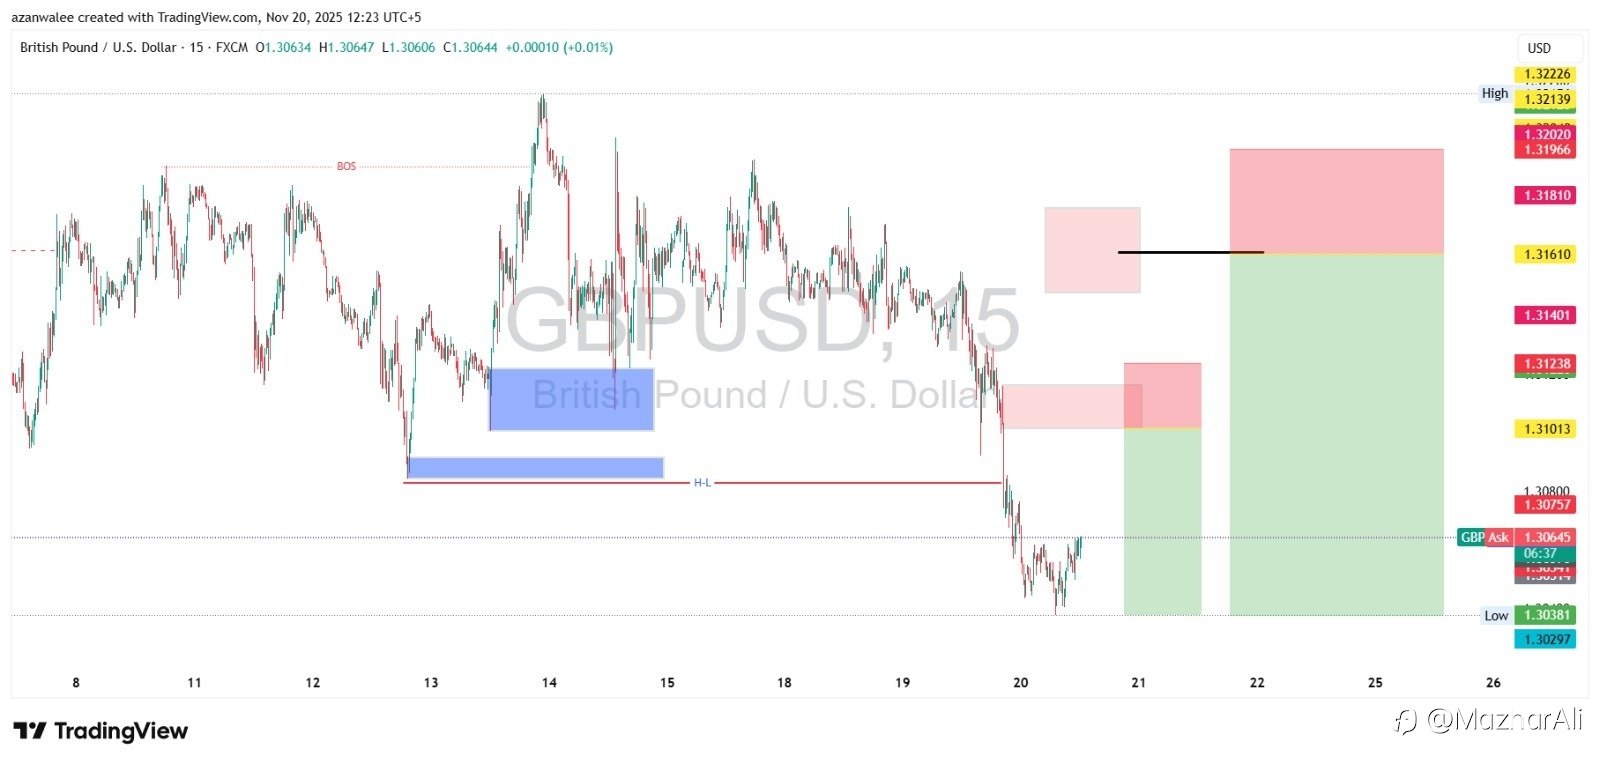
GBPUSDis currently respecting a clear bearish market structure after breaking below the recent Higher-Low (HL) level. The Break of Structure (BOS) confirmed bearish control, pushing price into a new downside leg.
🔻 Market Structure
- Price has created a fresh lower low, confirming continuation of the downtrend.
- Previous bullish demand zone (highlighted in blue) failed to hold, signalling weakening buyers.
- Current reaction shows price trading near intraday lows, maintaining bearish sentiment.
🔴 Supply Zones Identified
Two important supply areas are visible:
- Major supply zone at the top (red), expected to act as strong resistance.
- Internal supply zone that caused the last impulsive drop.
If price retraces into these supply zones, sellers may re-enter the market.
🟢 Bullish Retracement Possibility
Price is currently showing a minor corrective bounce.
A pullback into the supply zones may offer sell opportunities aligning with the higher-timeframe trend.
🎯 Trade Prediction (Based on Chart Zones)
- Sell Zone: 1.3140 – 1.3180 (major supply)
- Target TP: 1.3030 – 1.2980
- Stop Loss: Above 1.3180 zone
📌 Why Bearish?
- Strong BOS on the downside
- Failure of demand
- Momentum clearly favors sellers
- Clean liquidity areas below price remain unmitigated
📉 Overall Outlook
GBPUSD remains bearish, and any pullback into the highlighted supply zones may give continuation setups toward the lower liquidity targets.
면책 조항: 본 게시글에 표현된 견해는 전적으로 작성자의 견해이며 Followme의 공식 입장을 대변하지 않습니다. Followme는 제공된 정보의 정확성, 완전성 또는 신뢰성에 대해 책임을 지지 않으며, 서면으로 명시적으로 언급되지 않는 한 해당 내용을 기반으로 취해진 어떠한 조치에 대해서도 책임을 지지 않습니다.

