


Hello fellow traders,
In this technical article, we are going to present Elliott Wave charts of AUDJPY Forex pair . As our members know, the pair is showing a 3-wave pullback against the 96.23 low, taking the form of an Elliott Wave Zigzag structure.In the following sections, we will explain the Elliott Wave pattern and analysis, along with the potential targets.
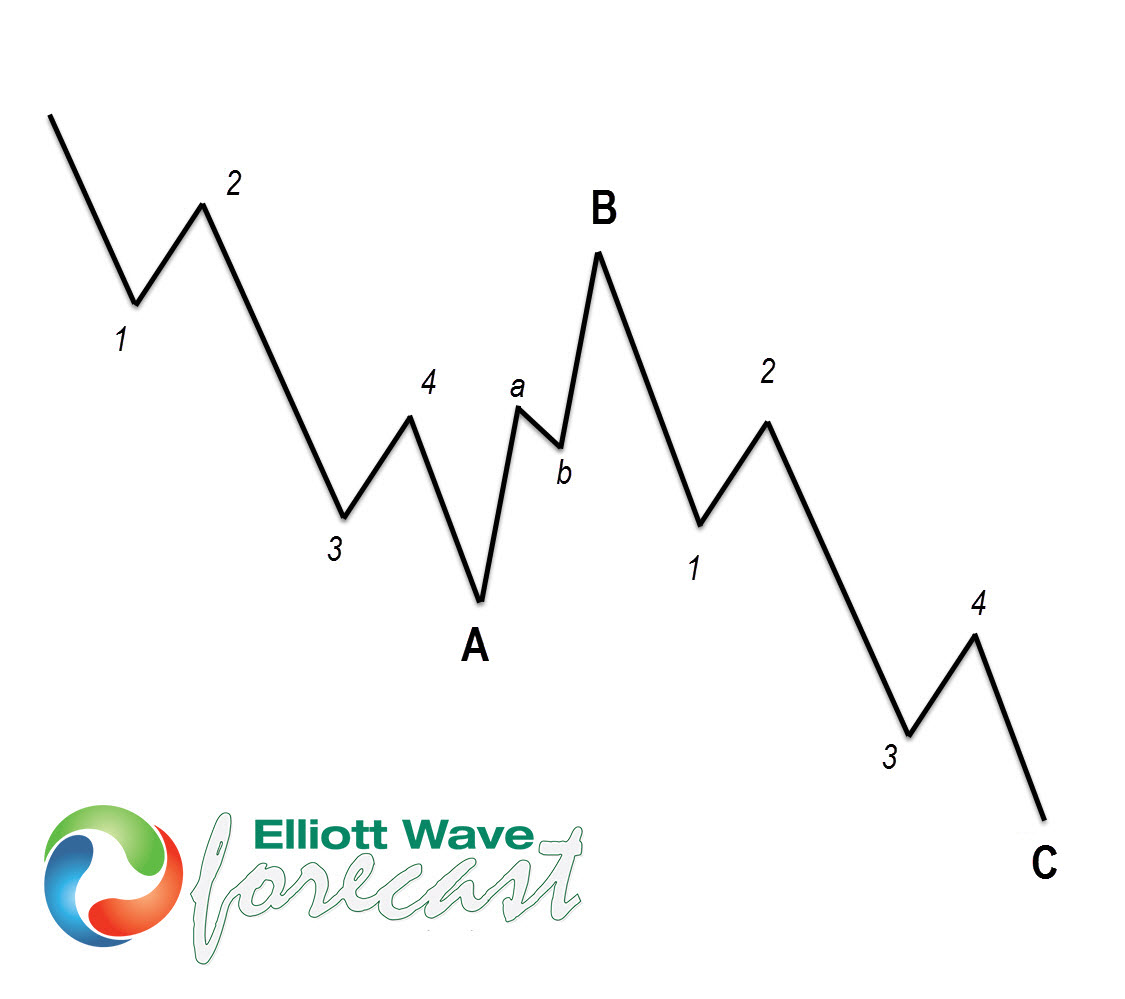
Before we take a look at the real market example, let’s explain Elliott Wave Zigzag.
Elliott Wave Zigzag is the most popular corrective pattern in Elliott Wave theory . It’s made of 3 swings which have 5-3-5 inner structure. Inner swings are A,B,C where A =5 waves, B=3 waves and C=5 waves. That means A and C can be either impulsive waves or diagonals. (Leading Diagonal in case of wave A or Ending in case of wave C) . Waves A and C must meet all conditions of being 5 wave structure, such as: having RSI divergency between wave subdivisions, ideal Fibonacci extensions and ideal retracements.
If you are new to Elliott Wave we recommend you to check out our Free Elliott Wave Educational Web Page and download our Free Elliott Wave Book.
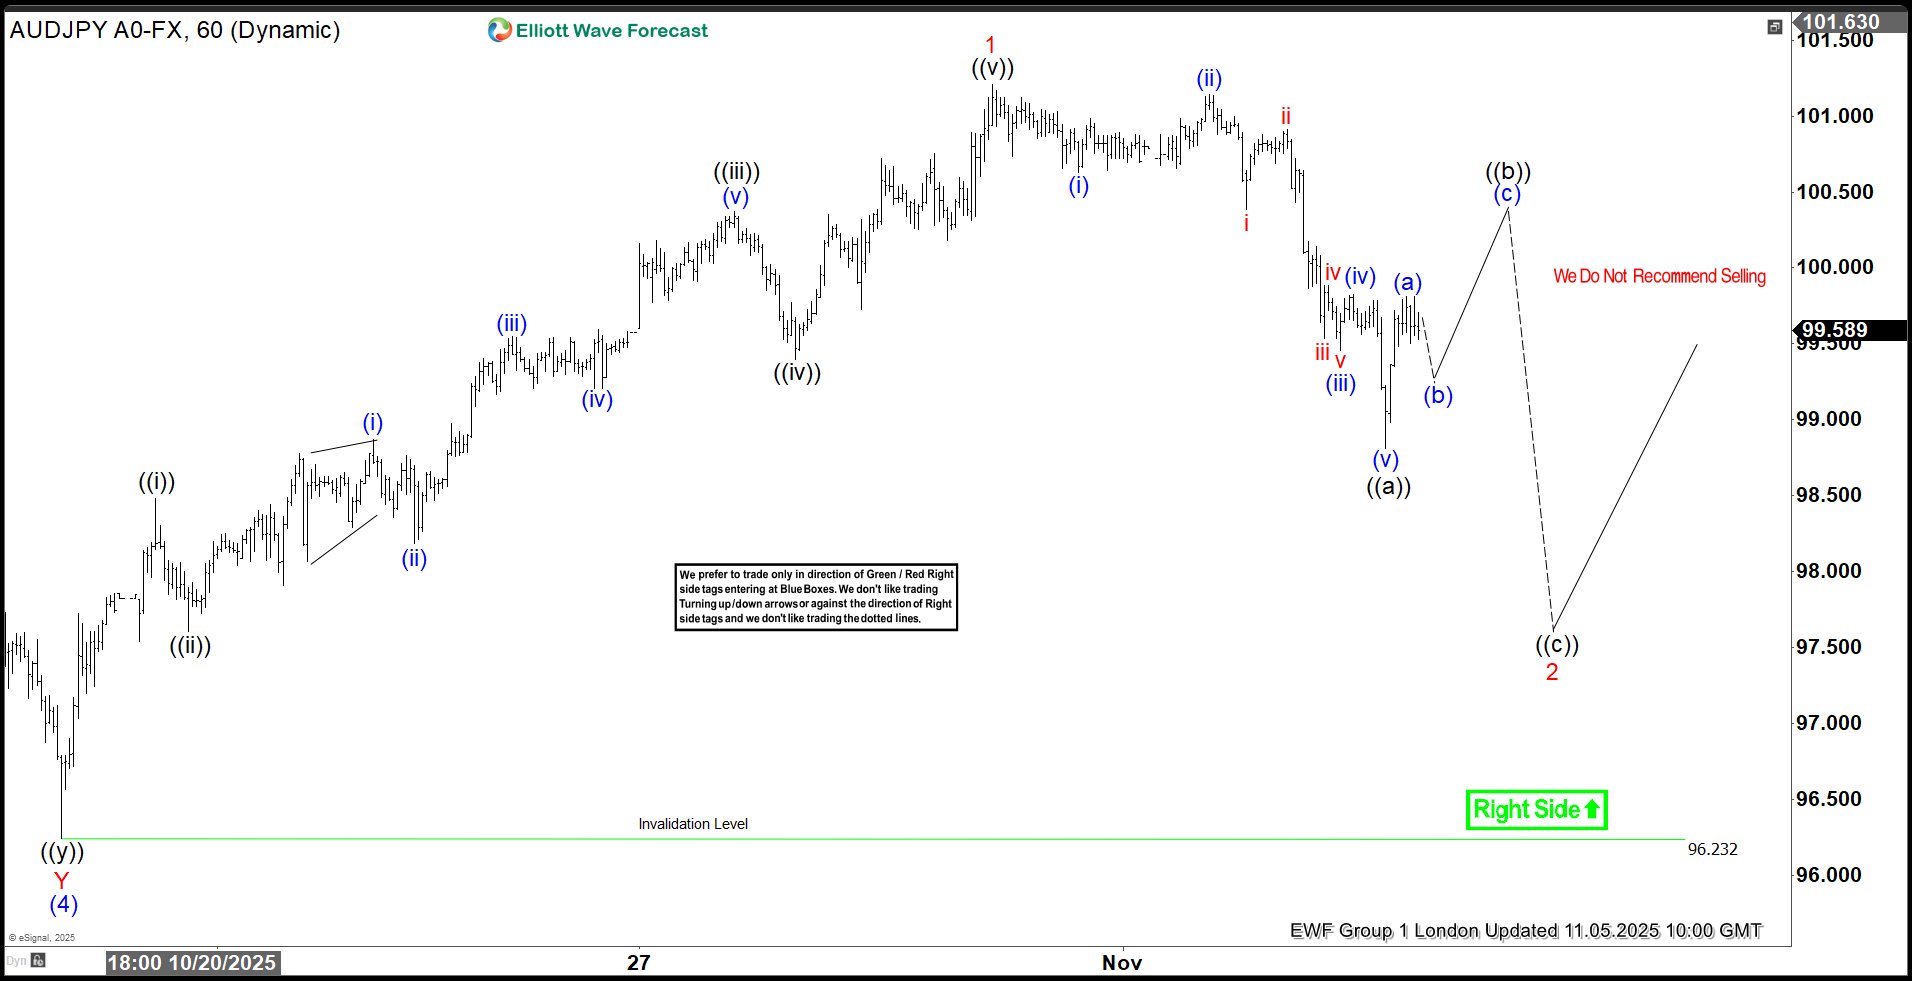
AUDJPY 1-Hour Elliott Wave Analysis 11.05.2025
AUDJPY ended the cycle from the 96.23 low as a 5-wave structure. The pair is now in the process of correcting that cycle. So far, we can count 5 waves in the decline, which suggests that the pullback remains incomplete.
The 5-wave drop from the peak indicates that we may have only completed the first leg of the correction. We expect to see a 3-wave bounce in wave ((b)), followed by another leg lower in wave ((c)) black.
Wave ((b)) typically completes within the 50%–61.8% Fibonacci retracement zone, which in this case comes in around the 100.017–100.293 area. In that zone, we expect sellers to appear again for another leg down in wave ((c)).
Didi you know? 90% of traders fail because they don’t understand market patterns. Are you in the top 10%? Test yourself with this advanced Elliott Wave Test
Official trading strategy on How to trade 3, 7, or 11 swing and equal leg is explained in details in Educational Video, available for members viewing inside the membership area.
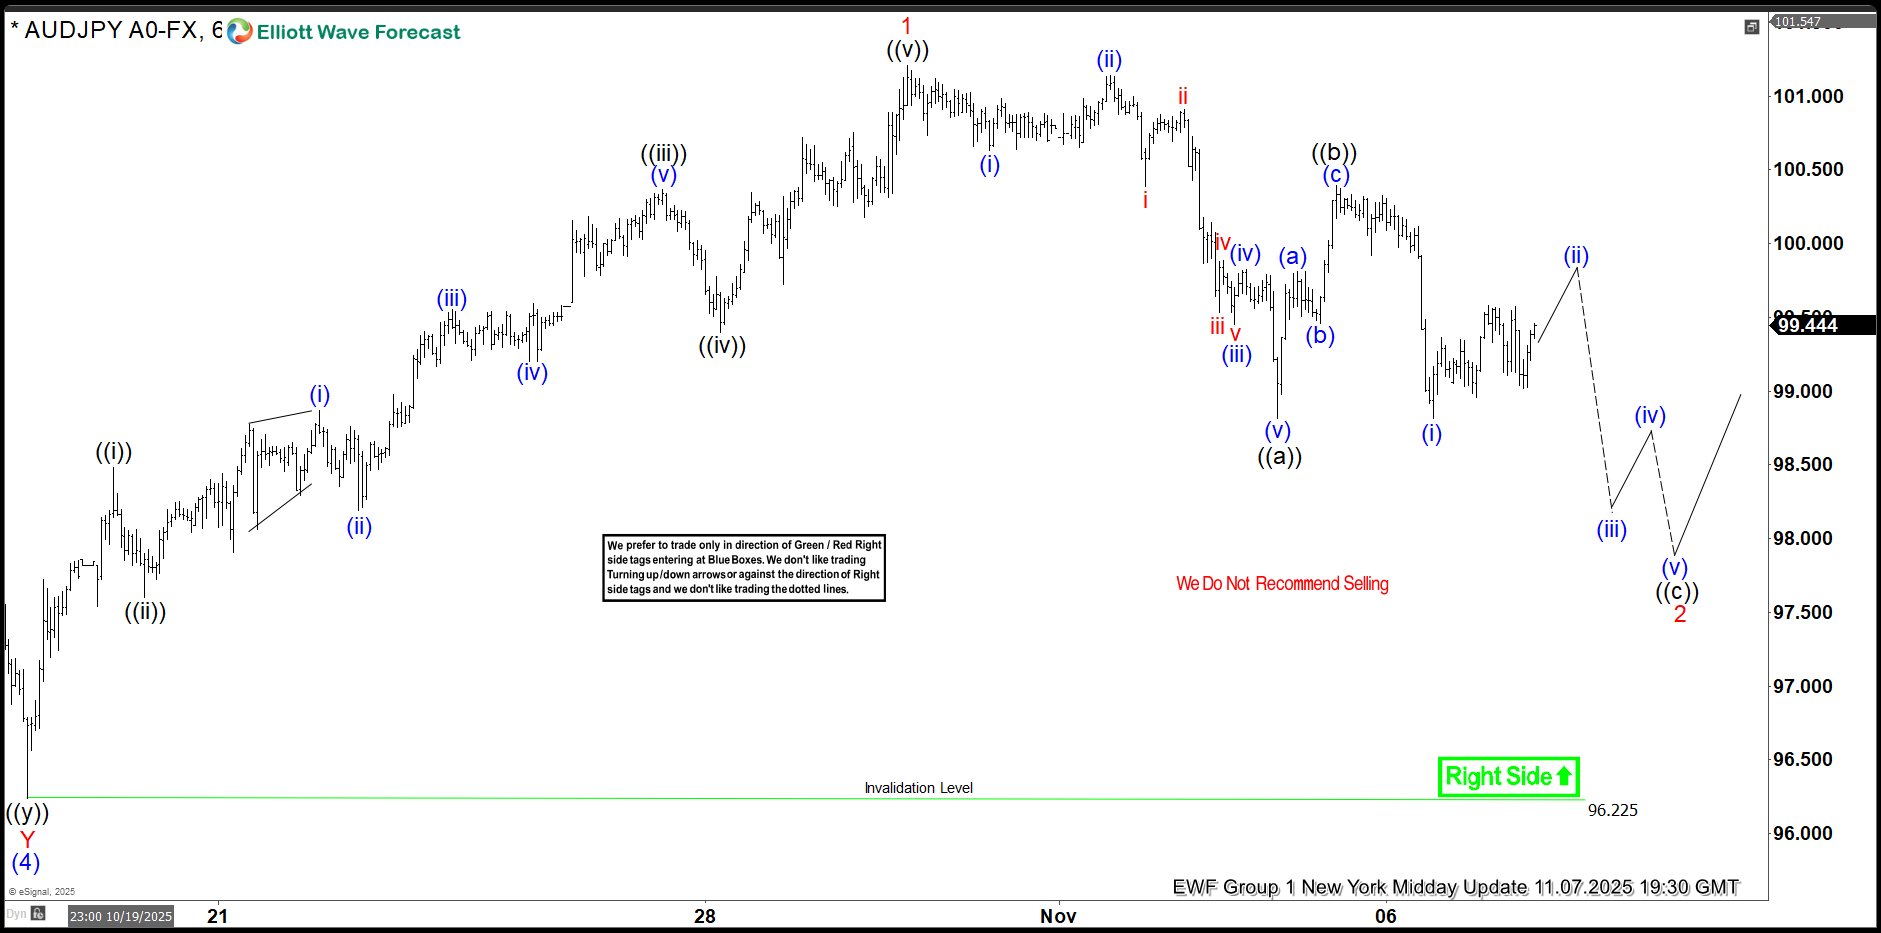
AUDJPY 1-Hour Elliott Wave Analysis 11.07.2025
AUDJPY completed a 3-wave bounce in wave ((b)) black, right within the 50%–61.8% Fibonacci retracement zone (100.017–100.293), as expected. From that area, the pair experienced a sharp decline.
While below the 100.40 high, we can count wave ((b)) as completed, and the pair can continue trading lower within wave ((c)). The next potential target area for buyers is seen at 97.97 -97.48.
Keep in mind that market is dynamic and presented view could have changed in the mean time. You can check most recent charts with target levels in the membership area of the site. Best instruments to trade are those having incomplete bullish or bearish swings sequences. We put them in Sequence Report and best among them are shown in the Live Trading Room
Our chat rooms in the membership area are available 24 hours a day, providing expert insights on market trends and Elliott Wave analysis. Don’t hesitate to reach out with any questions about the market, Elliott Wave patterns, or technical analysis. We’re here to help
면책 조항: 본 게시글에 표현된 견해는 전적으로 작성자의 견해이며 Followme의 공식 입장을 대변하지 않습니다. Followme는 제공된 정보의 정확성, 완전성 또는 신뢰성에 대해 책임을 지지 않으며, 서면으로 명시적으로 언급되지 않는 한 해당 내용을 기반으로 취해진 어떠한 조치에 대해서도 책임을 지지 않습니다.

