


In this technical blog, we will look at the past performance of the 4-hour Elliott Wave Charts of NVDA. We presented to members at the elliottwave-forecast. In which, the rally from 07 April 2025 low is unfolding as an impulse structure. Showing a higher high sequence favored more upside extension to take place. Therefore, we advised members not to sell the stock & buy the dips in 3, 7, or 11 swings at the blue box areas. We will explain the structure & forecast below:
NVDA 4-Hour Elliott Wave Chart From 9.08.2025
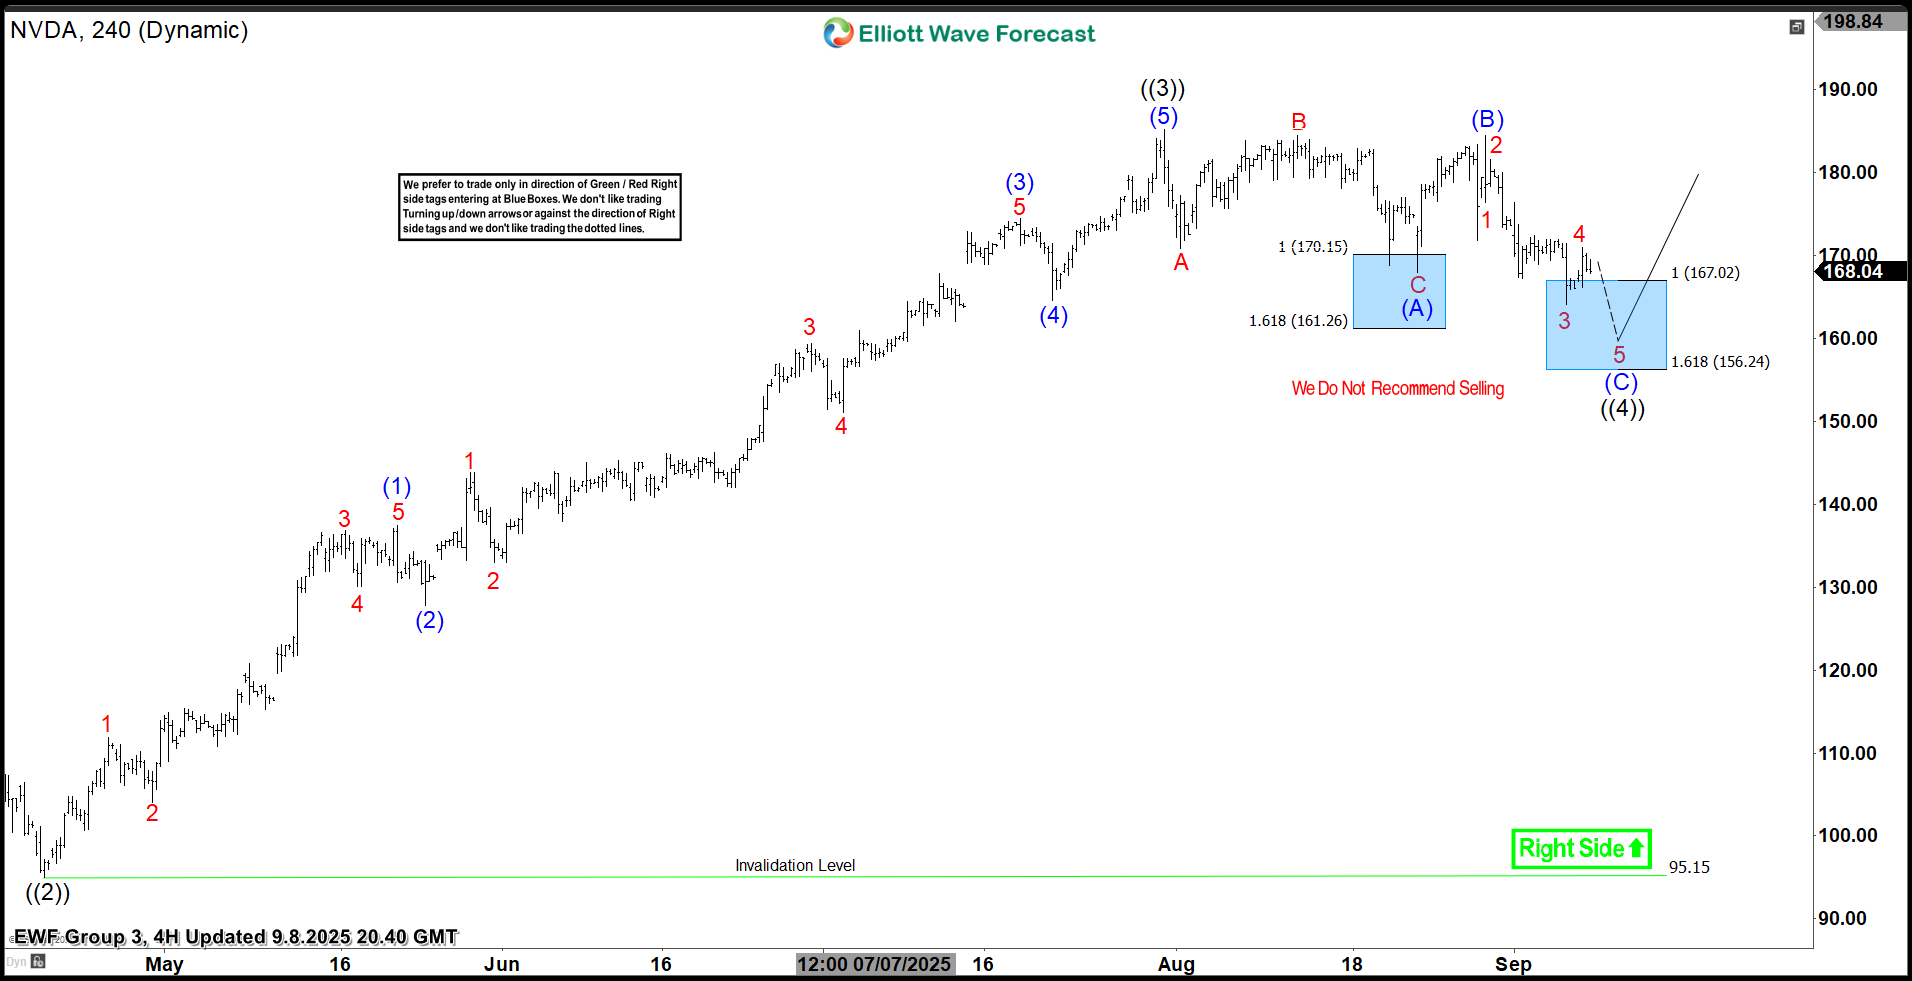
Here’s the 4-hour Elliott wave chart from the 9.08.2025 update. In which, the cycle from the 21 April 2025 low ended in wave ((3)) at $184.48 high. Down from there, the stock made a pullback in wave ((4)) to correct that cycle. The internals of that pullback unfolded as Elliott wave flat structure where wave (A) ended at $168 low. Wave (B) bounce ended at $184.47 high & wave (C) managed to reach the blue box area at $167.02- $156.24. From there, buyers were expected to appear looking for the next leg higher or for a 3 wave bounce minimum.
NVDA Latest 4-Hour Elliott Wave Chart From 9.21.2025
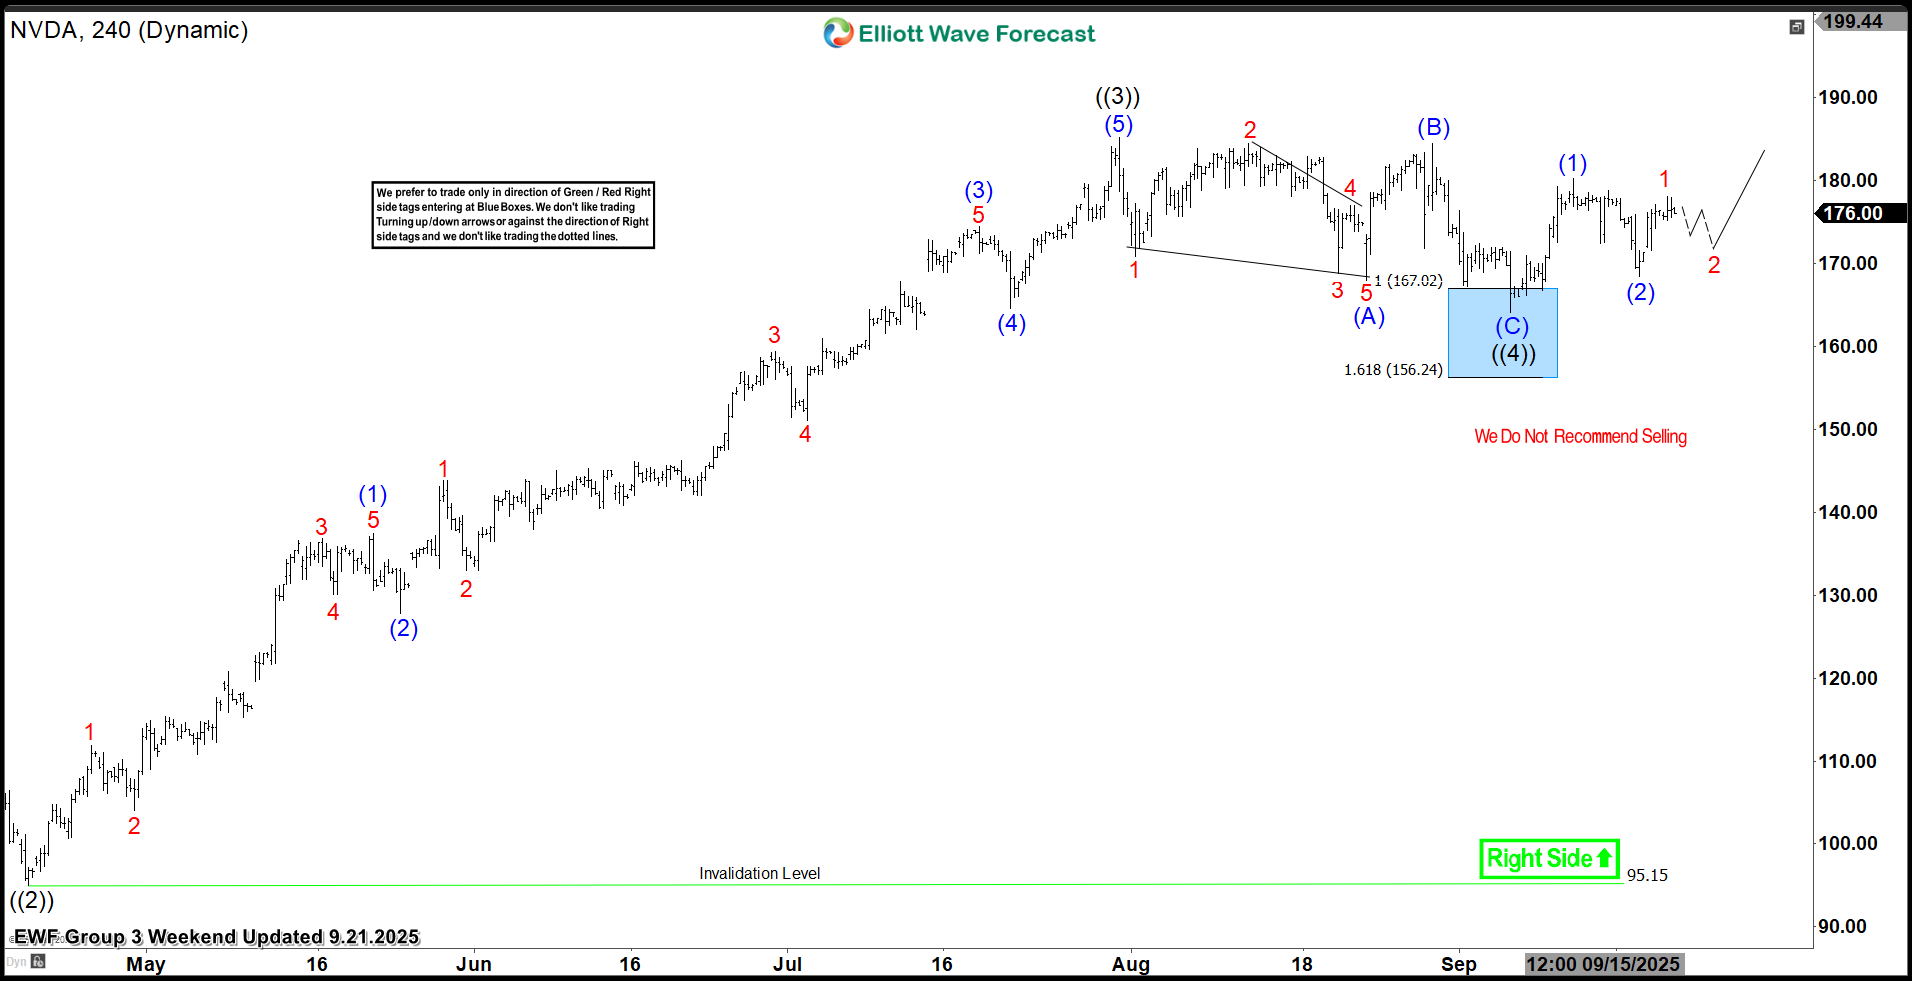
This is the latest 4-hour Elliott wave Chart from the 9.21.2025 Weekend update. In which the NVDA is showing a reaction higher taking place, right after ending the zigzag correction within the blue box area. Allowed members to create a risk-free position shortly after taking the long position at the blue box area. However, a break above $184.48 high is still needed to confirm the next extension higher towards $189.48- $197.31 area minimum & avoid a double correction lower.
면책 조항: 본 게시글에 표현된 견해는 전적으로 작성자의 견해이며 Followme의 공식 입장을 대변하지 않습니다. Followme는 제공된 정보의 정확성, 완전성 또는 신뢰성에 대해 책임을 지지 않으며, 서면으로 명시적으로 언급되지 않는 한 해당 내용을 기반으로 취해진 어떠한 조치에 대해서도 책임을 지지 않습니다.

