


IONQ Inc., a trailblazer in quantum computing, specializes in developing and manufacturing quantum computers. Founded in 2015 by Christopher Monroe and Jung Sang Kim, the company is based in College Park, Maryland.
This technical analysis of IONQ's weekly stock chart reveals key insights:
After a 3-wave pullback, the stock surged to new all-time highs.
This breakout confirms the potential for further growth, targeting the 65.84-73.16 range.
Based on this analysis, our recommendation is to hold onto your shares, as selling may not be the best strategy at this point.
IONQ Weekly Chart From 4.22.2025
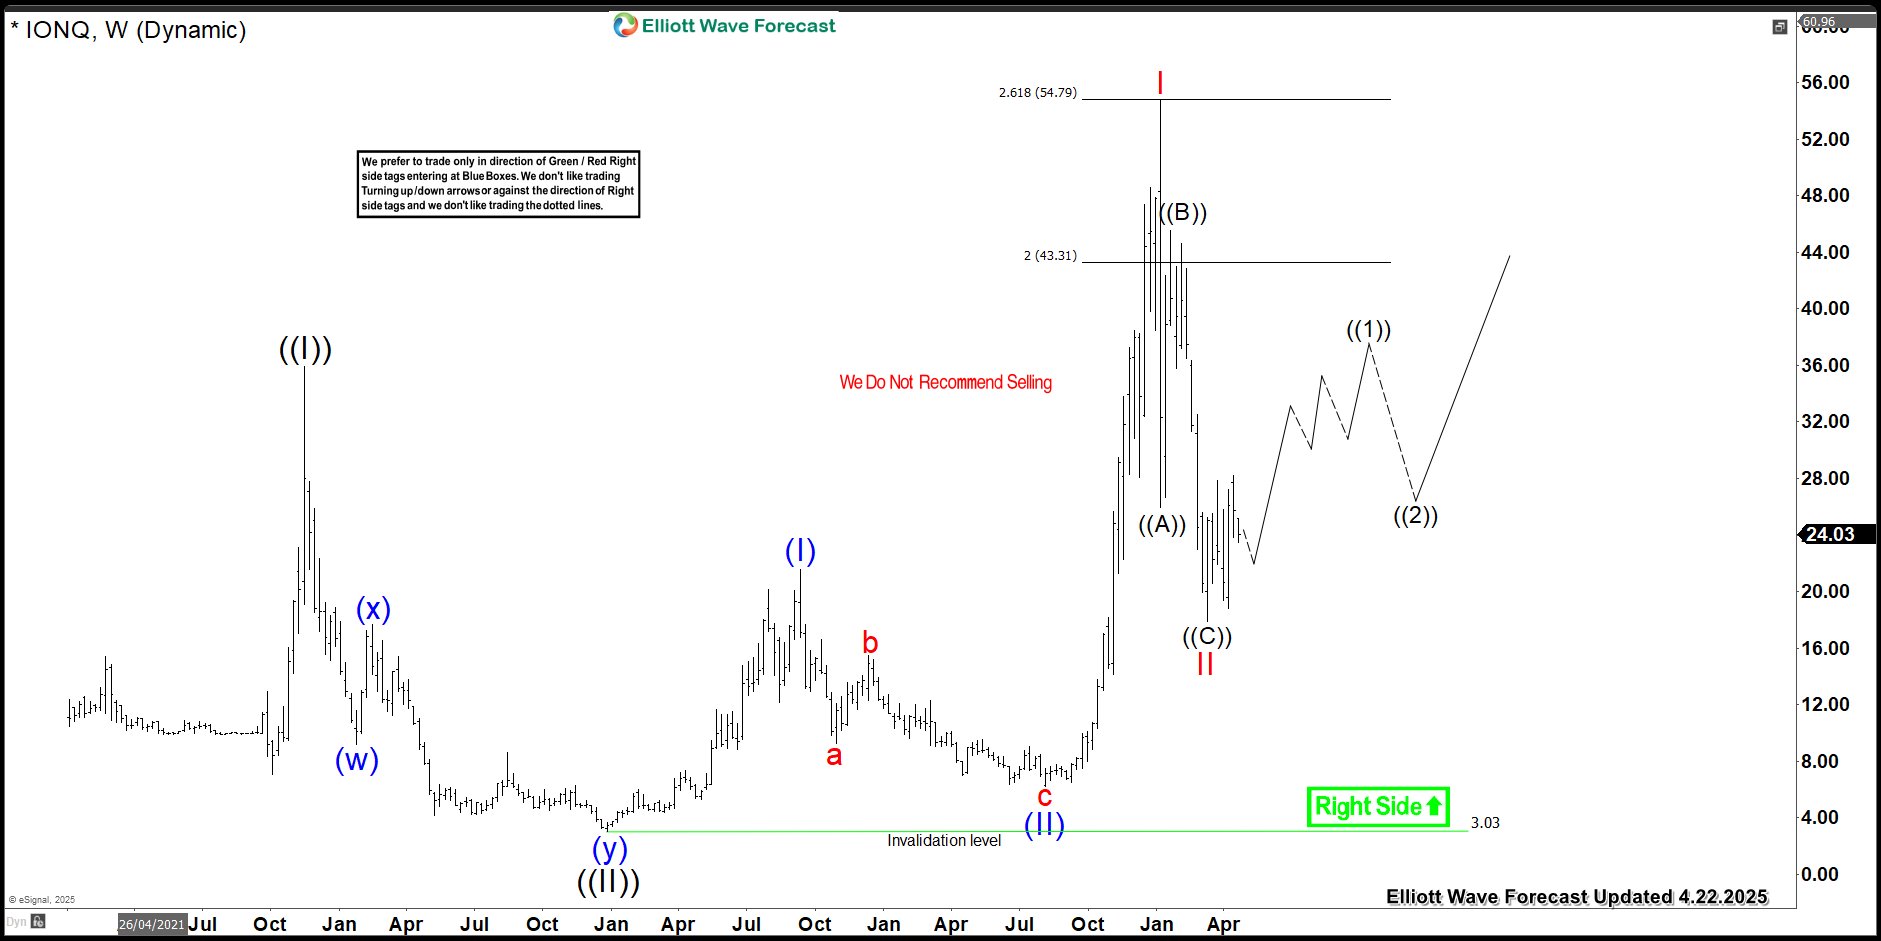
IONQ's past update covered stock price action can be broken down as follows: The rally to $35.90 marked the end of wave ((I)), followed by a pullback that formed a double three structure. This pullback consisted of wave (w) ending at $9.16. A bounce in wave (x) to $17.66, and wave (y) concluding at $3.03.
Subsequently, the stock entered an impulse sequence, with wave (I) peaking at $21.60 and wave (II) correcting to $6.22. A strong rally ensued, culminating in wave I at $54.74, followed by a 3-wave pullback in wave II. This pullback unfolded as a zigzag correction: wave ((A)) ended at $25.92, wave ((B)) bounced to $45.56, and wave ((C)) concluded at $17.88.
IONQ Latest Elliott Wave Chart From 9.15.2025
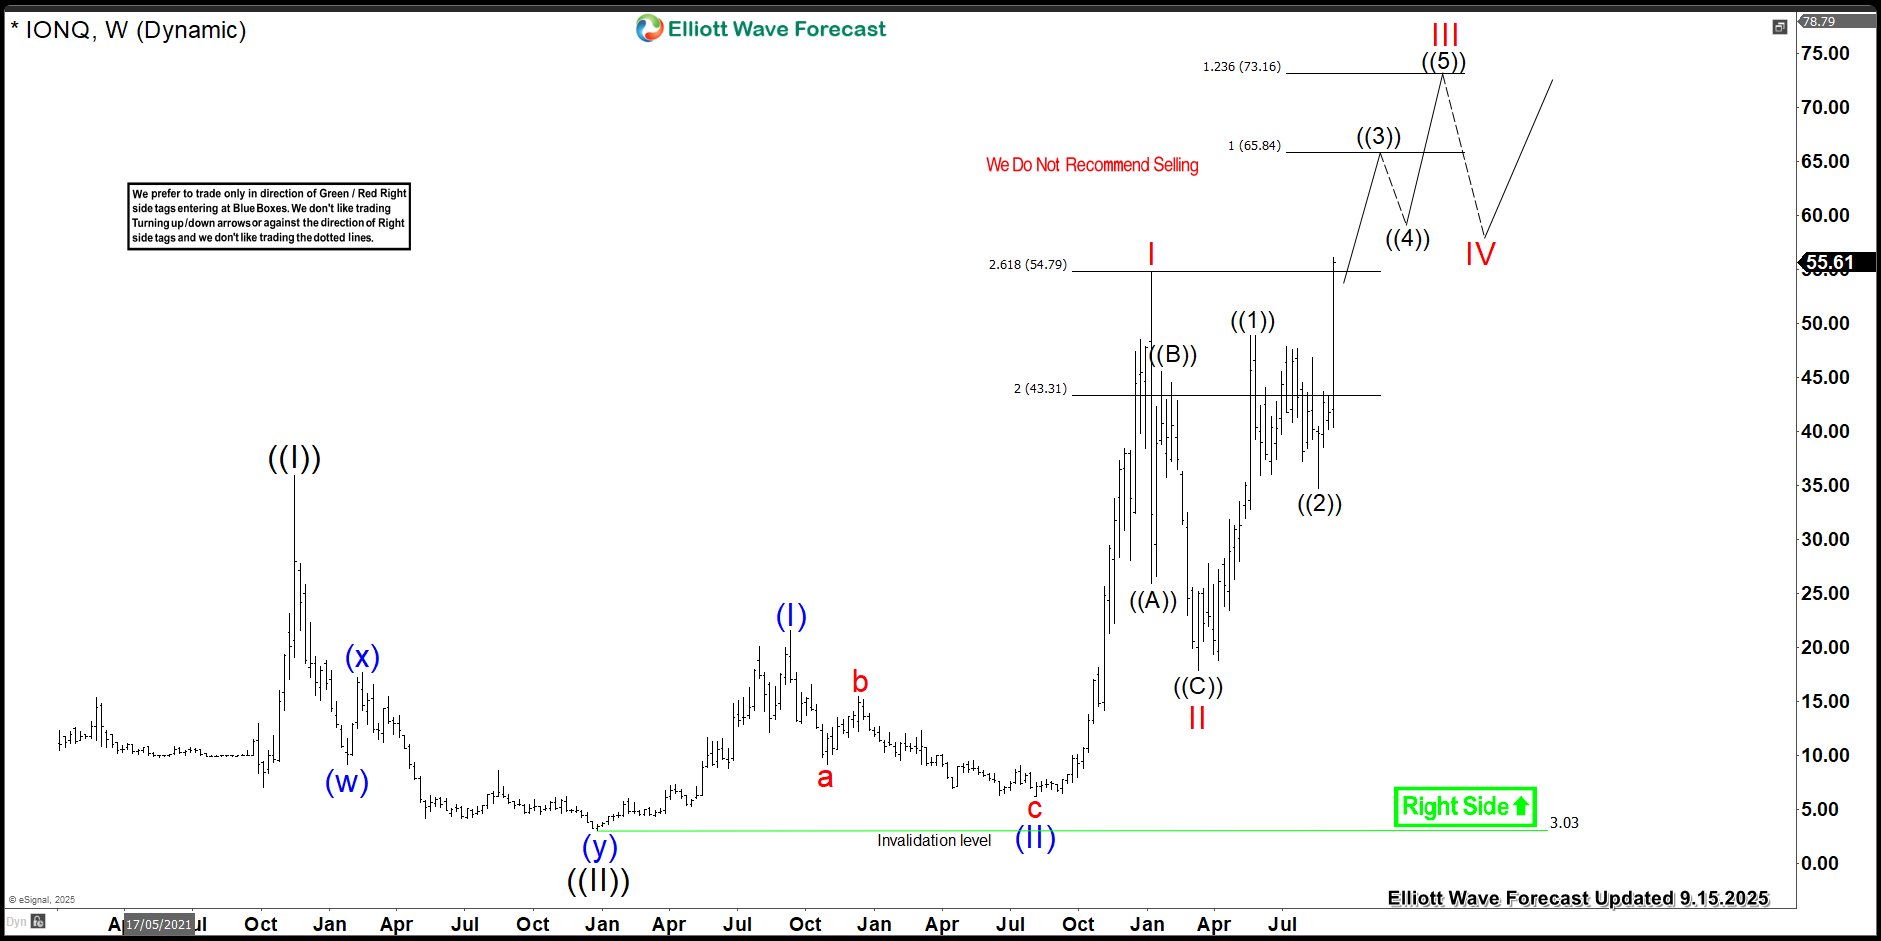
Since then, IONQ has surged to new all-time highs, indicating potential for further growth towards the $65.84-$73.16 range. Until this target is reached, dips are expected to remain supported within 3, 7, or 11 swings. Based on this analysis, selling is not recommended.
면책 조항: 본 게시글에 표현된 견해는 전적으로 작성자의 견해이며 Followme의 공식 입장을 대변하지 않습니다. Followme는 제공된 정보의 정확성, 완전성 또는 신뢰성에 대해 책임을 지지 않으며, 서면으로 명시적으로 언급되지 않는 한 해당 내용을 기반으로 취해진 어떠한 조치에 대해서도 책임을 지지 않습니다.

