


After it completed a 55% rally from April 2025 to July 2025, TXN is correcting the impulse rally. At the extreme of the current pullback, buyers can find new entry. What's the buying zone? Check the rest of the post and be sure to read everything.
Texas Instruments (TXN) is a global semiconductor company known for designing and manufacturing analog and embedded processing chips. With products used in everything from industrial equipment to personal electronics, TXN plays a critical role in powering modern technology. Its consistent innovation and strong market presence make it a closely watched stock in the tech sector.
TXN completed its long-term grand supercycle degree wave ((II)) in October 2002, bottoming near $13. From that point, the stock began an extraordinary two-decade rally as grand supercycle degree wave ((III)) unfolded. Wave (I) of ((III)) ended in August 2007 at $39.6, followed by a sharp correction in wave (II), which took prices back down to about $13.4 in December 2008. Wave (III) then started in December 2008, and the stock turned strongly bullish after surpassing its prior all-time high of $99.8 from March 2000. It went on to reach a new peak of $202.2 in October 2021. That high marked the completion of wave III of (III) of ((III)). Afterward, TXN entered a corrective wave IV that extended until October 2023. From there, it resumed its advance and went on to register a fresh high of $220.38 in November 2024.
From the peak of November 2024 the stock fell to complete a 7-swing pullback for wave ((2)). The wave ((2)) pullback ended in the blue box where buyers were waiting to buy the stock again. Thus, from the blue box, it rallied sharply in a clear 5-wave structure to complete wave (1) of ((3)) in 7/11/2025 as we mentioned in the 7/21/2025 update. In that update, we mentioned the 5-wave recovery was close to completion and traders/investors should expect a deep pullback. It happened as expected. Wave A of (2) pullback ended with a 5-wave impulse on 8/01/2025 and then followed by a 3-wave correction for wave B
TXN Elliott Wave Analysis – 9/01/2025

On 1st September, 2025, we used the chart below in the last update. The chart shows the end of wave B. Thus, we expected price to fall in wave C of (2). At the extreme of wave (2), we expected new bids from buyers.
TXN Elliott Wave Analysis – 9/14/2025
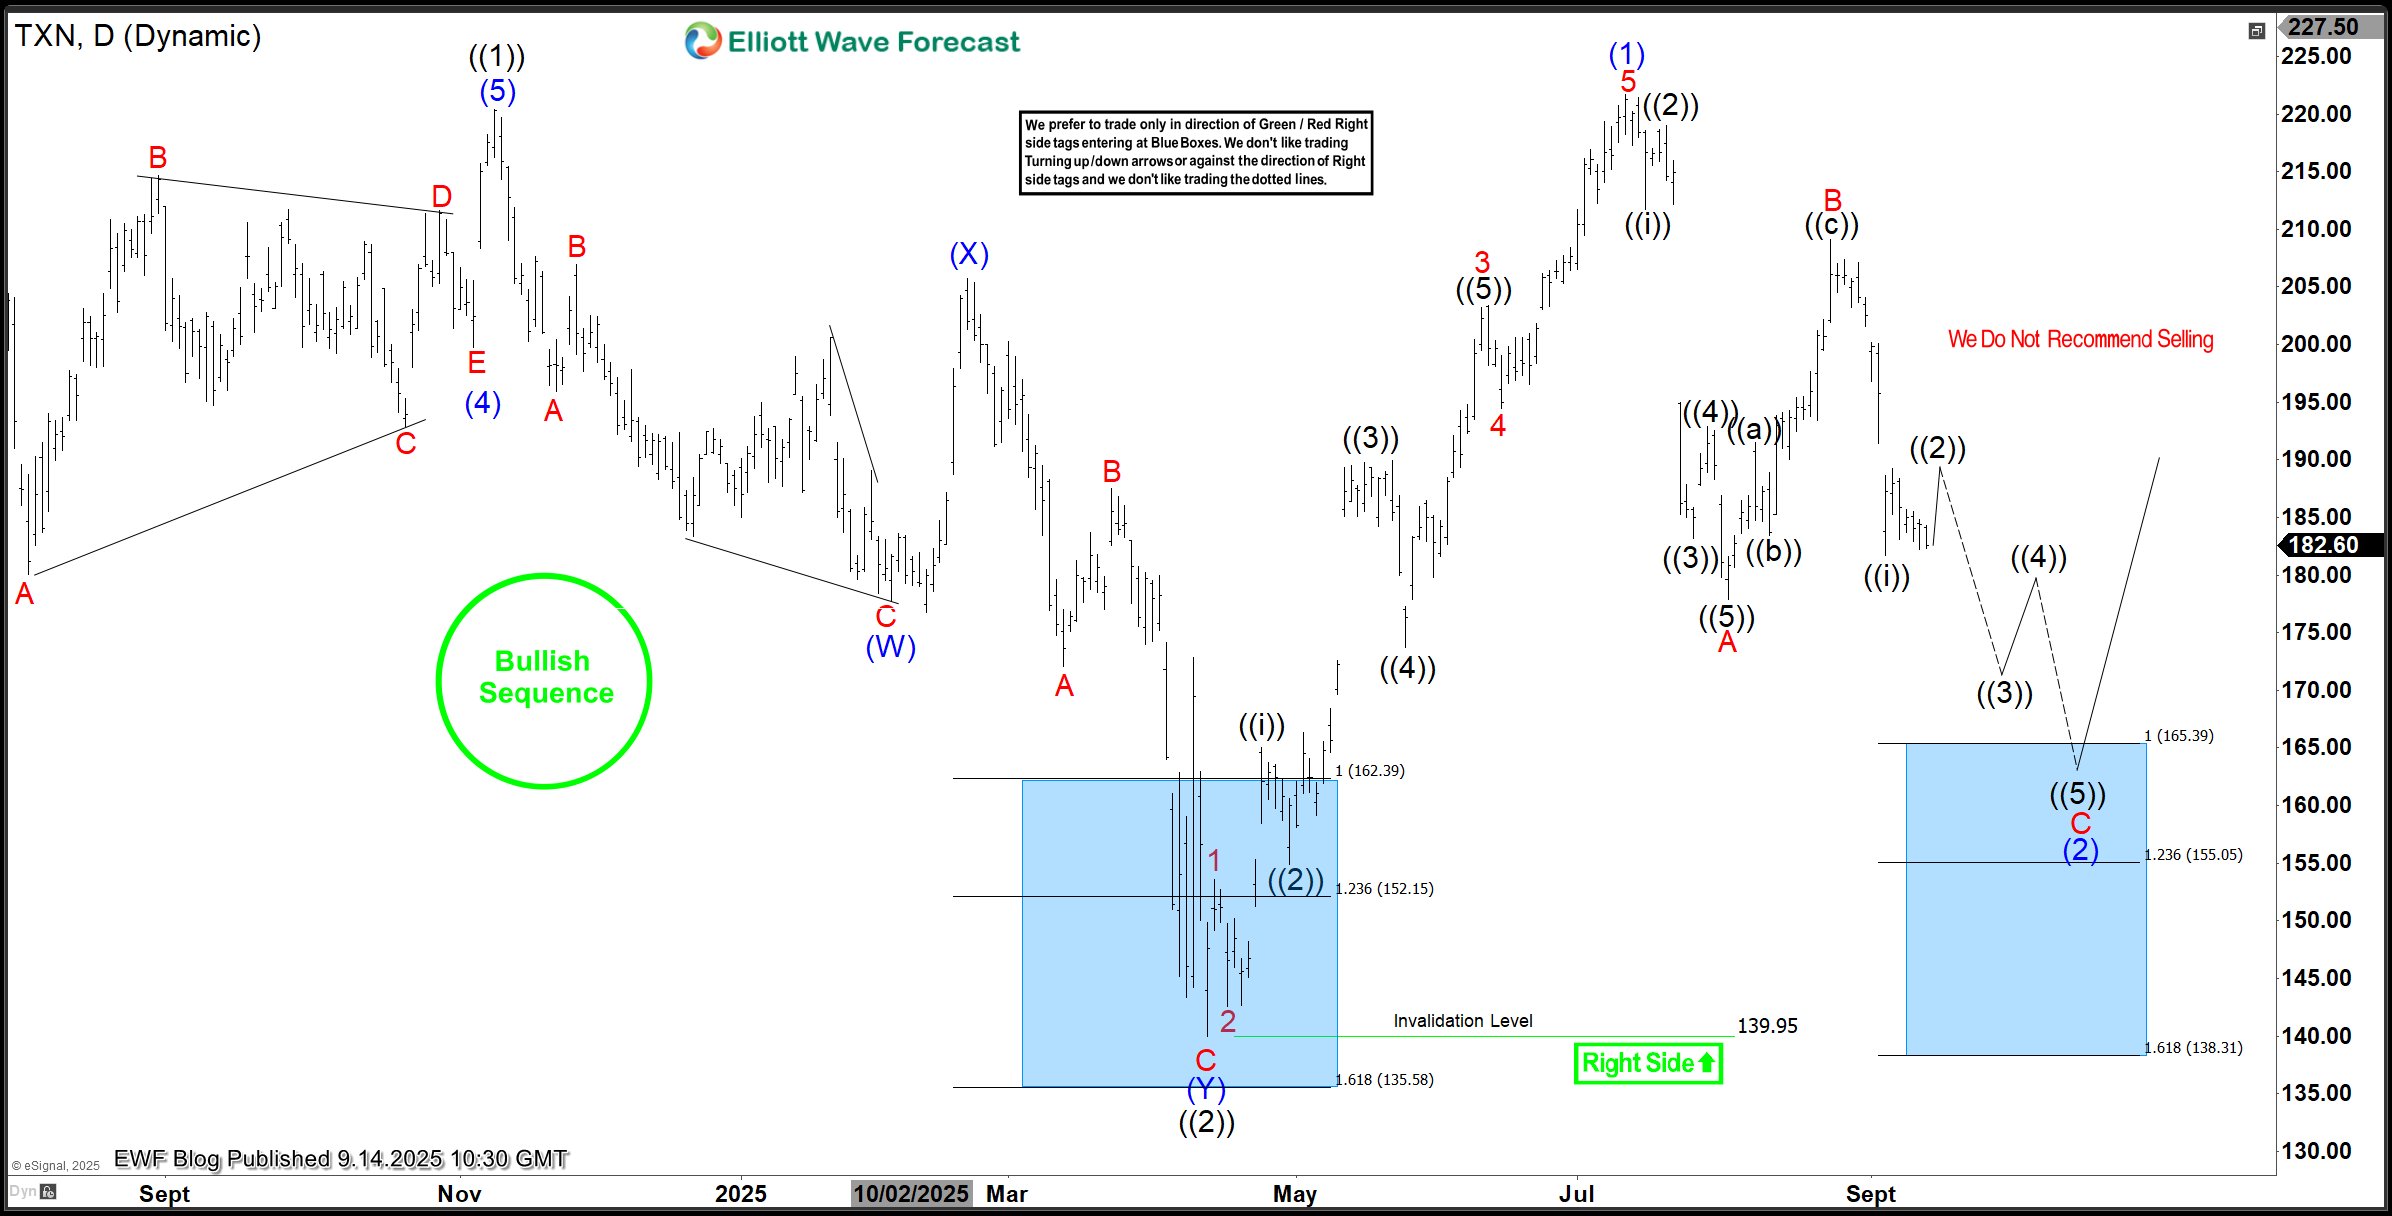
The decline is happening just as expected. It appears wave ((i)) of C of (2) has finished. Thus, two more legs lower could follow into the 165.39-138.31 blue box zone where we should see the end of wave (2). From the blue box, traders can expect at least a 3-swing bounce but an impulse recovery for wave (3) is expected to a new high.
면책 조항: 본 게시글에 표현된 견해는 전적으로 작성자의 견해이며 Followme의 공식 입장을 대변하지 않습니다. Followme는 제공된 정보의 정확성, 완전성 또는 신뢰성에 대해 책임을 지지 않으며, 서면으로 명시적으로 언급되지 않는 한 해당 내용을 기반으로 취해진 어떠한 조치에 대해서도 책임을 지지 않습니다.

