


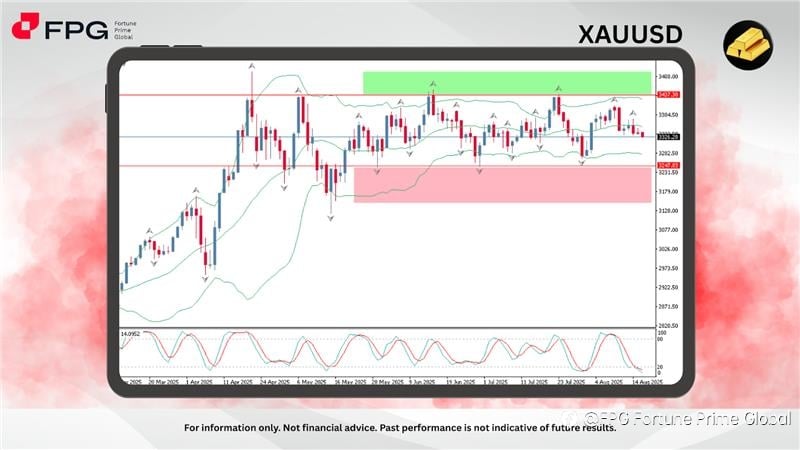
The XAUUSD daily chart shows that gold is consolidating in a sideways range, currently trading around 3326.28. Price action has been oscillating between the resistance zone near 3437.30 and the support area at 3247.83 for several weeks, reflecting market indecision. The repeated rejections from the upper boundary suggest strong selling pressure at higher levels, while buyers continue to defend the lower boundary, creating a well-defined range-bound structure.
Bollinger Bands confirm this consolidation phase, with the bands narrowing and containing price within the mid-level range. The upper band aligns closely with the resistance at 3437.30, reinforcing it as a critical breakout point for bullish continuation. On the downside, the lower Bollinger Band and the 3247.83 support converge, highlighting this zone as a key level that must hold to prevent further downside risk. The overall bias remains neutral until a decisive breakout occurs in either direction.
Momentum indicators show weakening bullish pressure. The Stochastic Oscillator (5,3,3) is turning down sharply from overbought territory and now approaching oversold levels, suggesting that sellers may test the lower boundary again. If price breaks below 3247.83, gold could extend losses toward the 3179.00 region. Conversely, a breakout above 3437.30 could trigger renewed buying momentum, opening the way toward 3488.00 and higher. Until then, range trading strategies remain favorable, with a focus on selling near resistance and buying near support.
Market Observation & Strategy Advice:
1. Current Position: XAUUSD is trading around 3326.28, consolidating within a well-defined sideways range after repeated rejections from higher levels.
2. Resistance: The key resistance stands at 3437.30, aligned with the upper Bollinger Band and the top of the recent trading range.
3. Support: Strong support is seen at 3247.83, with a deeper downside level near 3179.00 if selling pressure accelerates.
4. Indicators: The Stochastic Oscillator (5,3,3) is pointing downward, approaching oversold conditions, indicating potential for a near-term retest of the lower range. Bollinger Bands are tightening, reflecting reduced volatility and an impending breakout setup.
5. Trading Strategy Suggestions:
- Sideways: Range traders may consider selling near 3437 and buying near 3248, until a breakout confirms.
- Bullish Scenario: A bullish breakout above 3437 could trigger momentum toward 3488 and higher, favoring long positions.
- Bearish Scenario: A bearish breakdown below 3247 may extend declines toward 3179, opening short opportunities.
- Risk Management: Given the sideways structure, tight stop-losses are recommended to avoid false breakouts.
Market Performance:
Precious Metals Last Price % Change
XPTUSD 1,333.71 −0.31%
XAGUSD 37.8750 −0.35%
Today’s Key Economic Calendar:
CN: FDI (YTD) YoY
EU: Balance of Trade
CA: Housing Starts
US: NAHB Housing Market Index
Risk Disclaimer This report is for informational purposes only and does not constitute financial advice. Investments involve risks, and past performance does not guarantee future results. Consult your financial advisor for personalized investment strategies.
#FortunePrimeGlobal# #trading# #FX# #Todayanalysis#
면책 조항: 본 게시글에 표현된 견해는 전적으로 작성자의 견해이며 Followme의 공식 입장을 대변하지 않습니다. Followme는 제공된 정보의 정확성, 완전성 또는 신뢰성에 대해 책임을 지지 않으며, 서면으로 명시적으로 언급되지 않는 한 해당 내용을 기반으로 취해진 어떠한 조치에 대해서도 책임을 지지 않습니다.

