


Oklo Inc (NYSE: OKLO) is rewriting the rules of the energy sector. While traditional utilities struggle with aging infrastructure, this nuclear innovator has delivered 300%+ gains since April 2025 - turning skeptics into believers. The sector hasn't seen this level of disruptive potential since the early days of solar. Today, we break down OKLO’s Elliott Wave structure, key targets, and why bulls remain in control.
Elliott Wave Analysis
OKLO's explosive rally since April has decisively breached February's $59.14 peak (Wave I), confirming a strong 3-wave advance in motion. The current impulse shows Wave ((1)) peaking at $73.55, Wave ((2)) bottoming at $50.08, and Wave ((3)) now extends higher. This incomplete bullish sequence forms part of a larger nesting structure within Wave III - typically the strongest and most extended phase in Elliott Wave theory.
OKLO Daily Chart
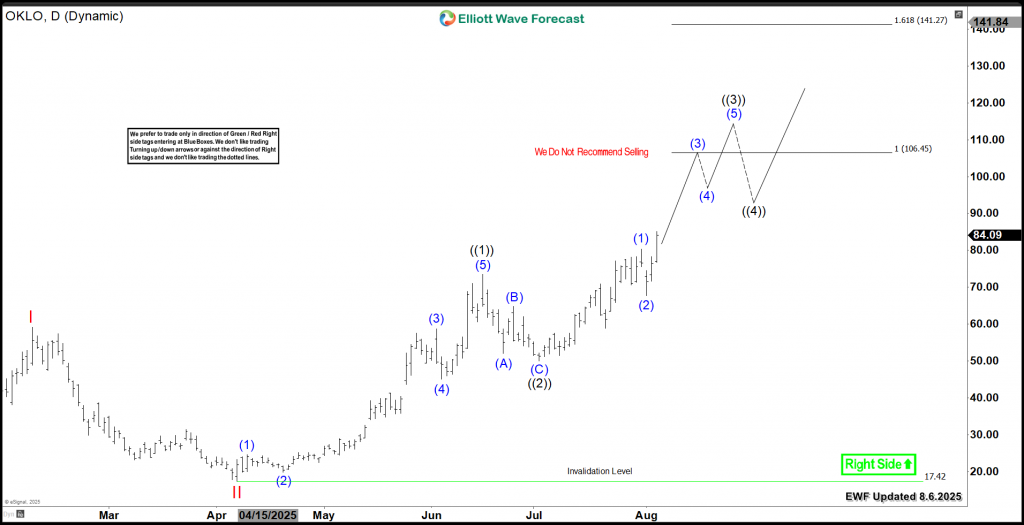
OKLO's daily cycle analysis from April 2025 lows reveals a textbook Elliott Wave progression. Subsequently, the stock now surges through Wave ((3)) and our projections confirm an equal legs target between $106-$141, with multiple technical factors supporting this outlook.
Conclusion
The bullish sequence formed by OKLO will support the stock through the upcoming short term corrections, creating opportunities to buy daily and weekly pullbacks using our Elliott Wave strategy. Consequently, the ideal approach is to enter positions once the stock completes a 3, 7, or 11 swing corrective sequence during pullbacks. Moreover, our extreme Blue Box system enhances precision, allowing traders to identify optimal entry points with clarity and confidence.
면책 조항: 본 게시글에 표현된 견해는 전적으로 작성자의 견해이며 Followme의 공식 입장을 대변하지 않습니다. Followme는 제공된 정보의 정확성, 완전성 또는 신뢰성에 대해 책임을 지지 않으며, 서면으로 명시적으로 언급되지 않는 한 해당 내용을 기반으로 취해진 어떠한 조치에 대해서도 책임을 지지 않습니다.

