


Wave (II) correction ends as NU begins a new impulsive cycle with strong upside potential supported by Elliott Wave analysis.
Nu Holdings Ltd. (NYSE: NU) continues to gain bullish traction as the stock completes a significant corrective phase. The weekly Elliott Wave structure suggests that wave (II) has ended, and a new impulsive wave higher is underway. This wave structure reflects a broader trend reversal and presents a promising setup for long-term investors.
After an initial five-wave rally into wave (I), NU entered a deep and complex correction labeled as wave (II). The structure unfolded as a W-X-Y double zigzag, which is typical in second-wave pullbacks. Despite the consolidation, the correction held well above the long-term invalidation level at $3.27, preserving the bullish outlook.
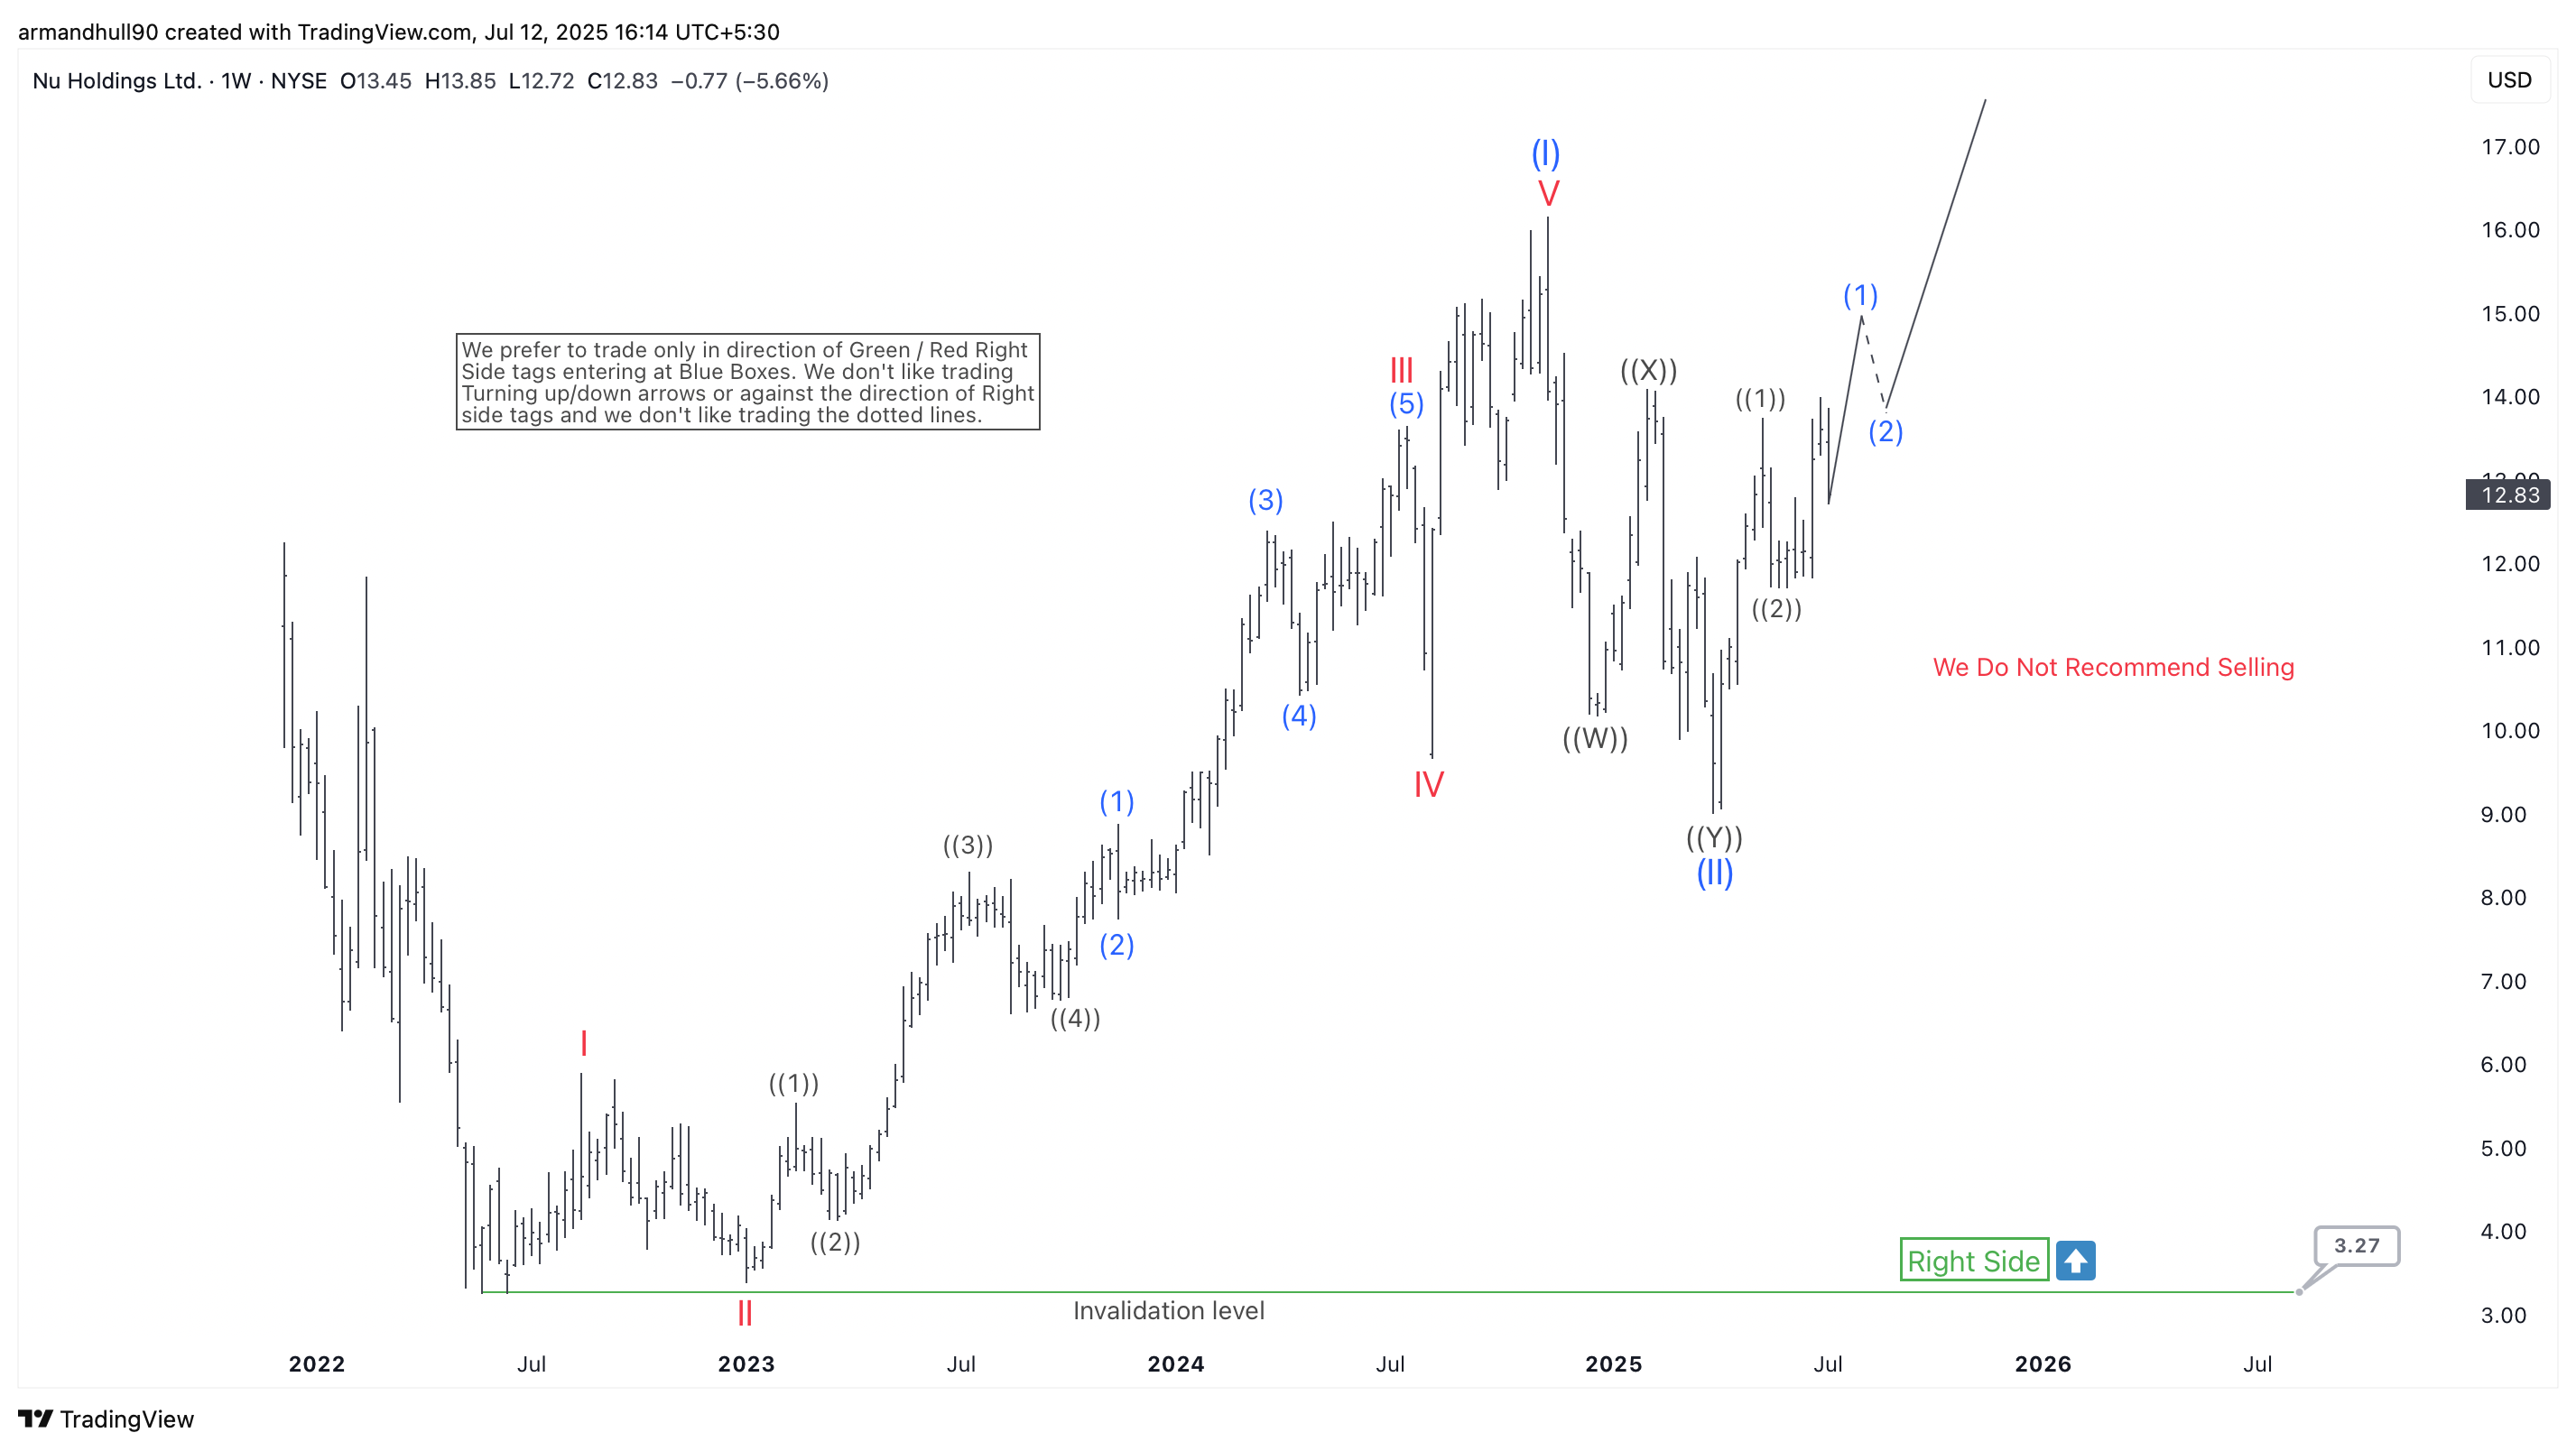
Now, price action from the bottom indicates the beginning of a new bullish sequence. Subwaves ((1)) and ((2)) of the next impulse appear to have already formed. NU is likely moving higher in wave ((3)), which often brings strong momentum. Once wave ((3)) completes, a minor pullback in wave ((4)) may follow before price resumes higher in wave ((5)).
The chart also highlights a “Right Side” tag, confirming that the preferred direction is up. Traders are advised not to trade against the trend, as emphasised by the “We Do Not Recommend Selling” message on the chart.
Summary:
In summary, NU looks to have completed its wave (II) correction and is advancing in a new bullish cycle. The broader Elliott Wave pattern supports higher targets in the coming months. Investors may consider looking for long opportunities on pullbacks, as long as the price stays above $3.27. The current setup offers a favorable risk-reward scenario aligned with the primary trend.
면책 조항: 본 게시글에 표현된 견해는 전적으로 작성자의 견해이며 Followme의 공식 입장을 대변하지 않습니다. Followme는 제공된 정보의 정확성, 완전성 또는 신뢰성에 대해 책임을 지지 않으며, 서면으로 명시적으로 언급되지 않는 한 해당 내용을 기반으로 취해진 어떠한 조치에 대해서도 책임을 지지 않습니다.

