In this technical blog, we are going to take a look at the past performance of USDCHF 1-Hour Elliott wave Charts that we presented to our members. In which, the decline to 6.13.2025 low took place as an impulsive structure and showed a lower sequence calling for more downside to happen. Therefore, our members knew that selling the bounces in the direction of the right side tag remained the preferred path. We will explain the Elliott wave structure & selling opportunity our members took below:
USDCHF 1-Hour Elliott Wave Chart From 6.18.2025
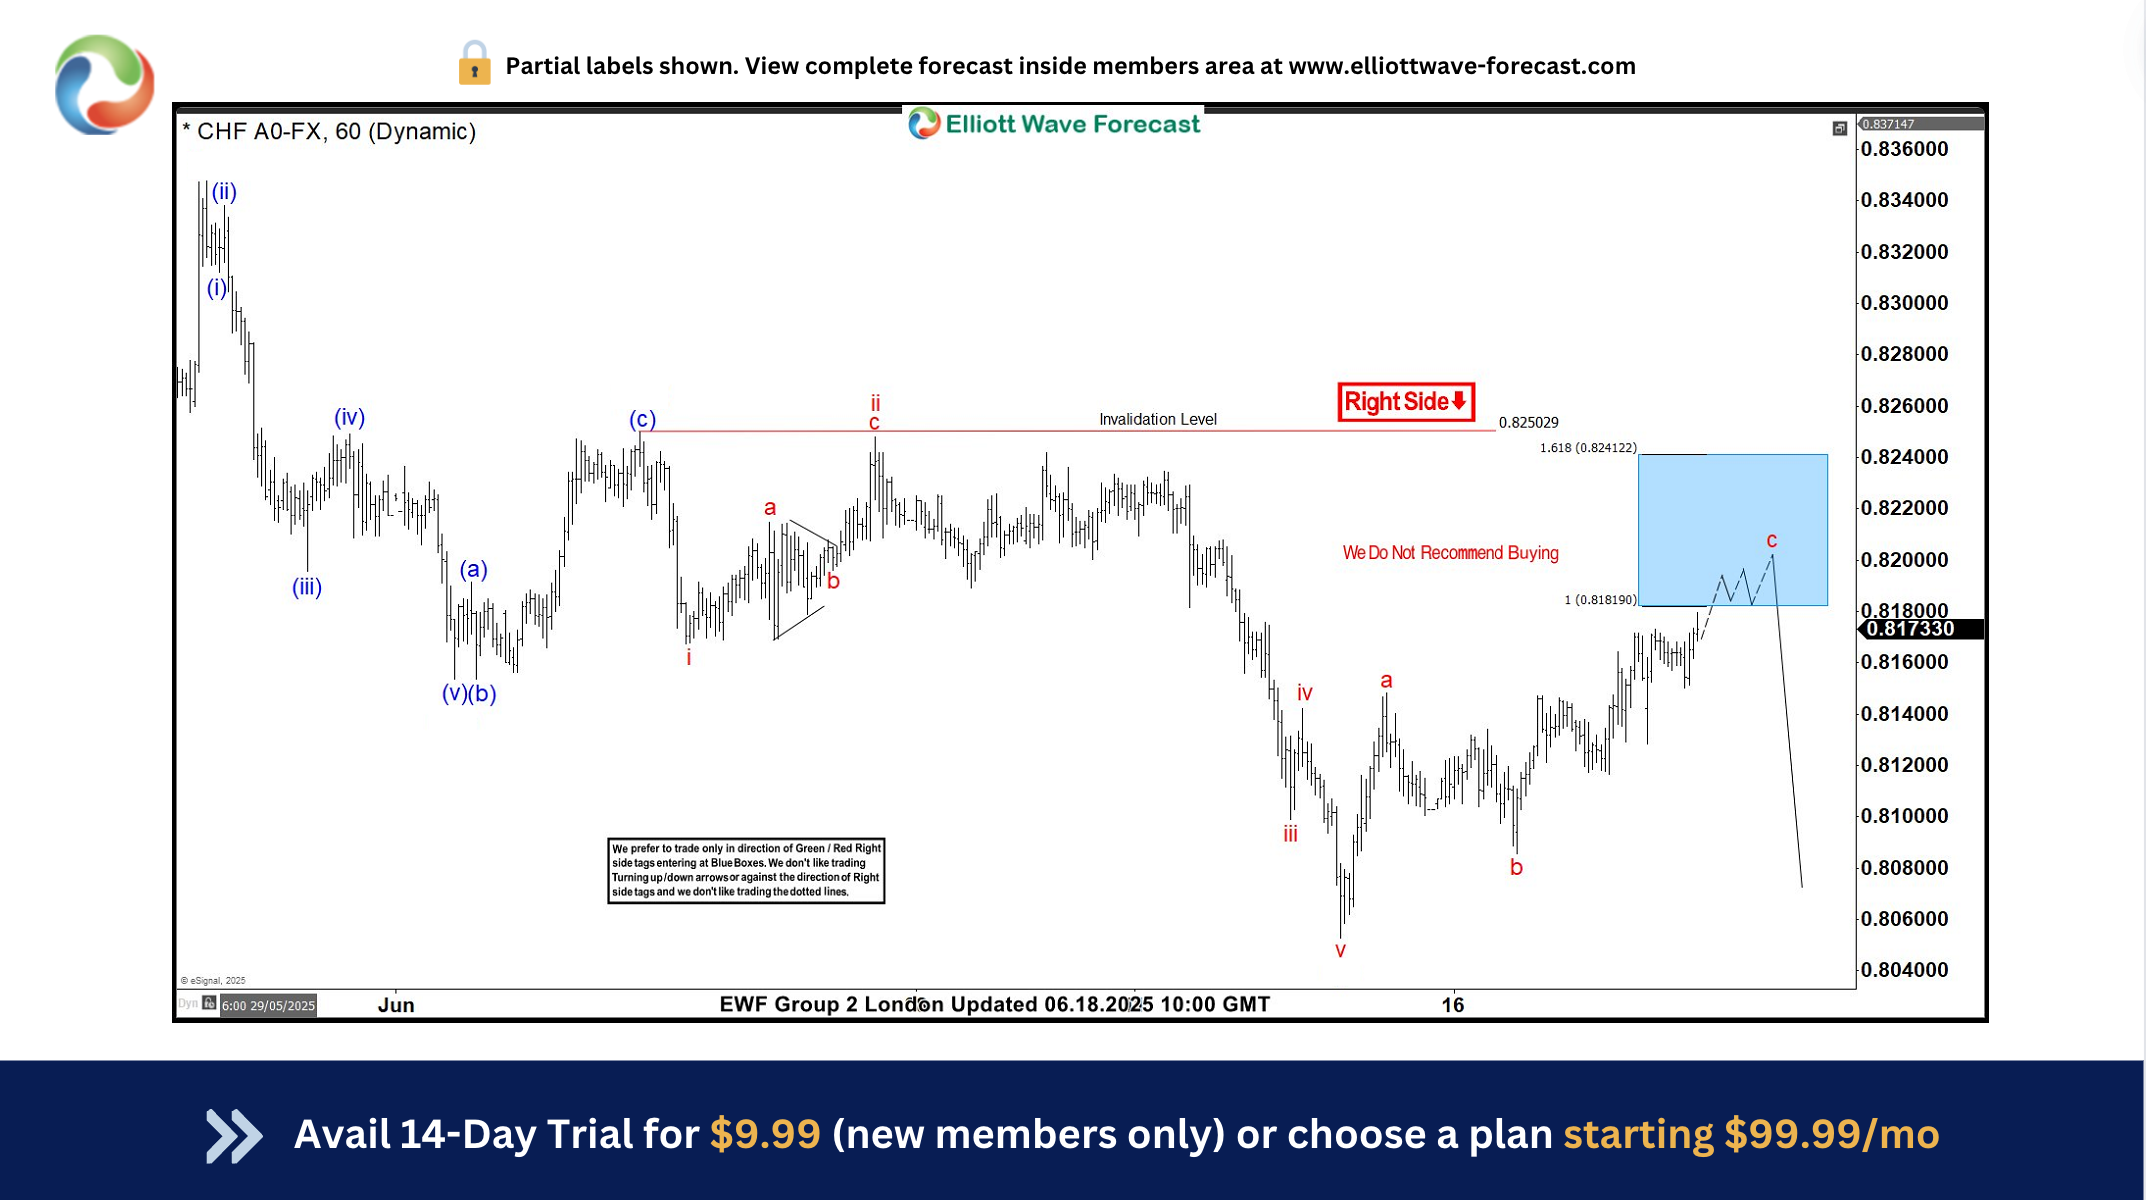
USDCHF 1-Hour Elliott Wave Chart from 6.18.2025 London update. In which the decline to $0.8052 low ended the decline from 5.12.2025 peak & made a bounce higher. Up from there, the pair made a bounce towards the blue box area. The internals of that bounce unfolded as zigzag structure where wave a ended at $0.8148 high. Wave b pullback ended at $0.8085 low. And wave c was expected to reach the blue box area. From there, sellers were expected to appear looking for further downside or a minimum 3-wave reaction lower.
$USDCHF 1-Hour Elliott Wave Chart From 6.25.2025
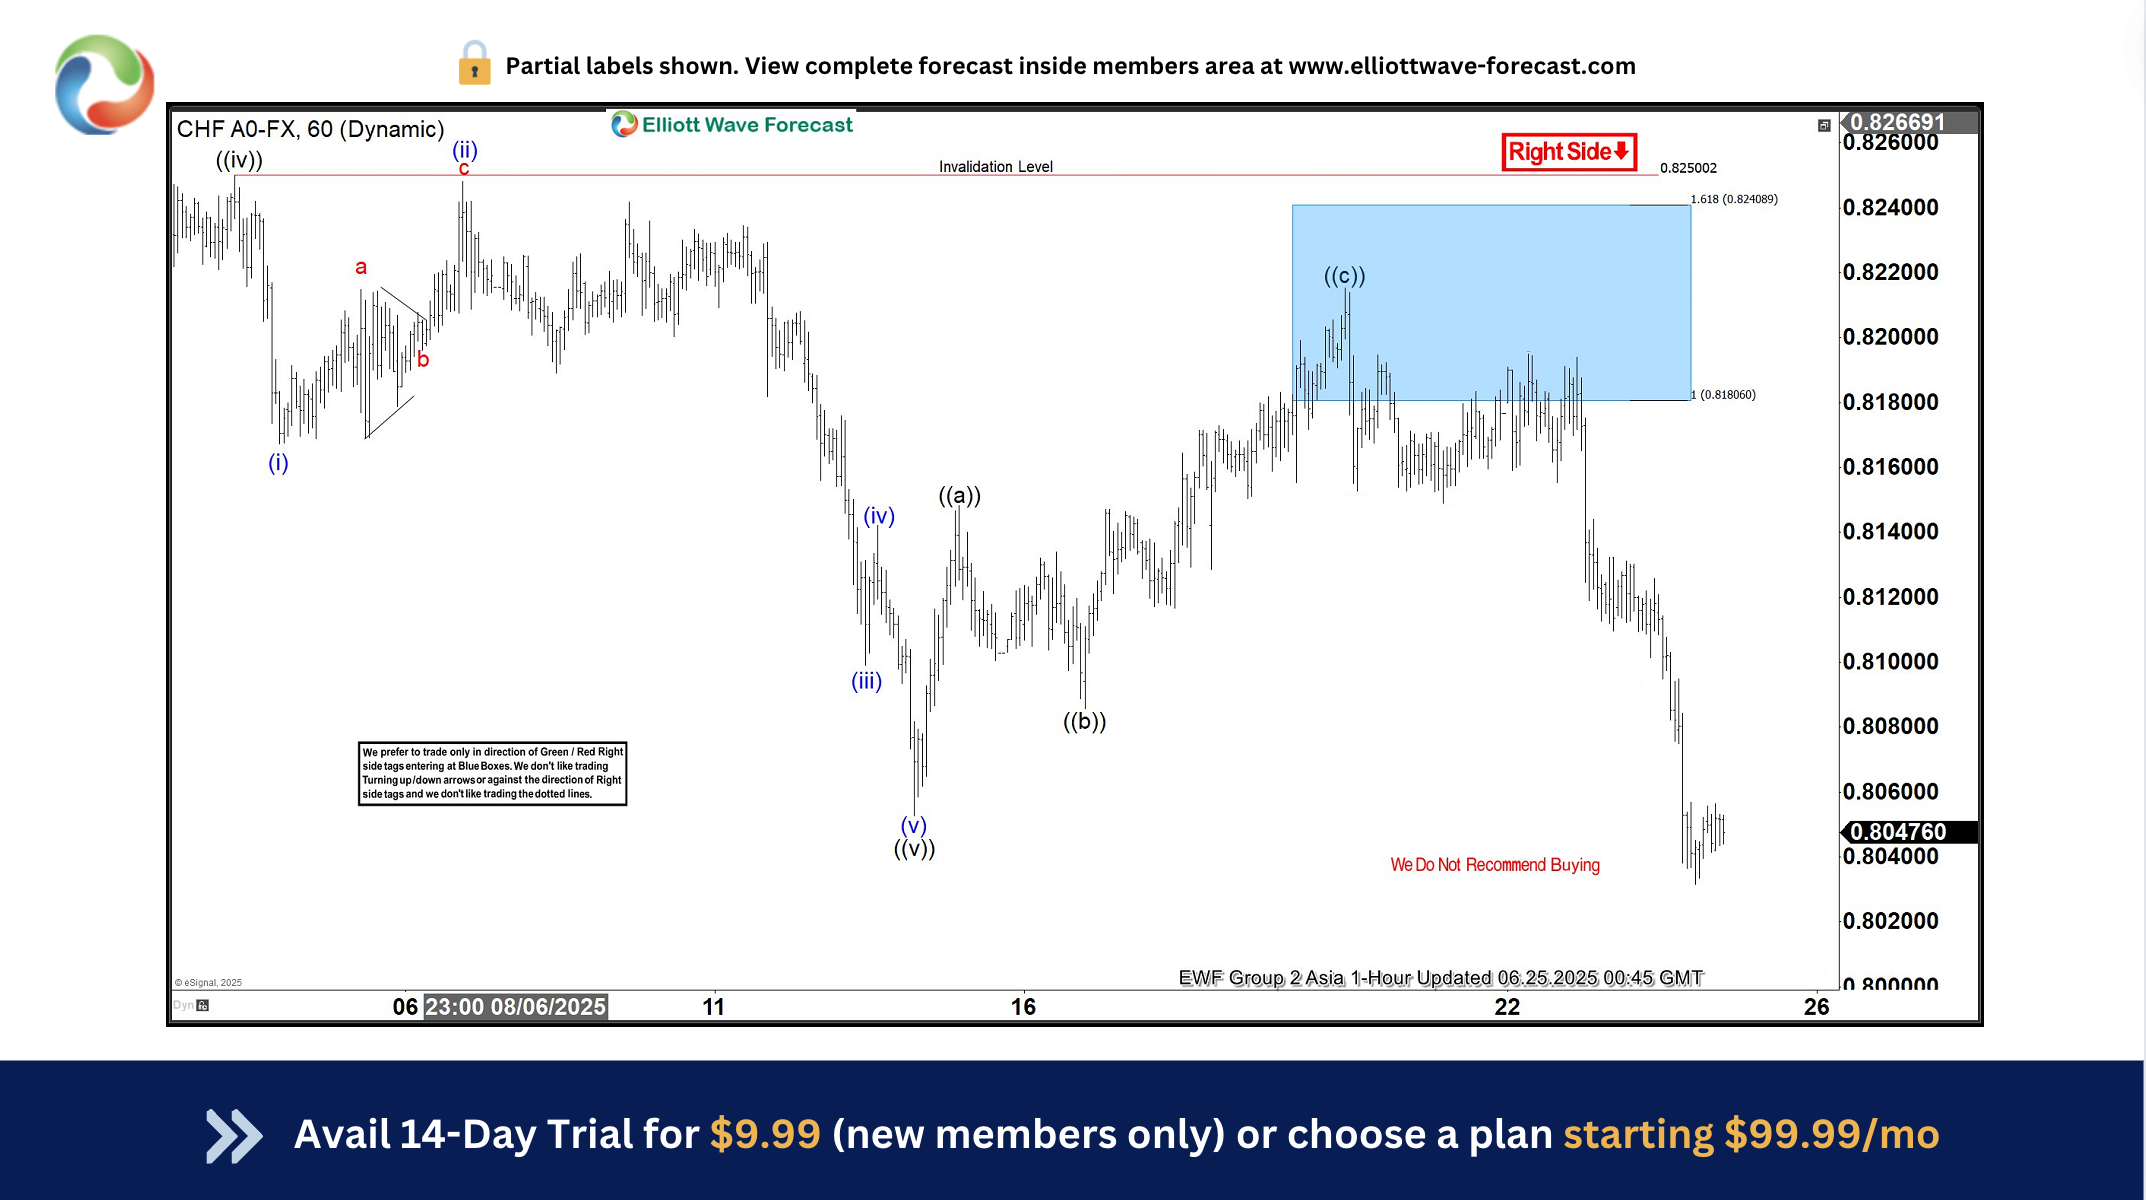
This is the latest 1-Hour view from the 6.25.2025 Asia update. In which the pair is showing a reaction lower taking place from the blue box area. Allowing shorts to get into a risk-free position shortly after taking the position. Since then the pair has already made a new low below 6.13.2025 low confirming the next extension lower towards $0.7790- $0.7528 target area.
면책 조항: 본 게시글에 표현된 견해는 전적으로 작성자의 견해이며 Followme의 공식 입장을 대변하지 않습니다. Followme는 제공된 정보의 정확성, 완전성 또는 신뢰성에 대해 책임을 지지 않으며, 서면으로 명시적으로 언급되지 않는 한 해당 내용을 기반으로 취해진 어떠한 조치에 대해서도 책임을 지지 않습니다.

더 오래된 의견은 없습니다. 소파를 가장 먼저 잡으십시오.