


Walmart (NYSE: WMT) is down 20% from the peak but is it the right time to start buying the stock at current levels ? In this article we'll go over the Elliott Wave structure for the current move and explain the potential expected path.
WMT is current currently showing an impulsive 5 waves decline from the peak. The move is proposed to be wave ((A)) of a corrective 3 waves Zigzag structure and it should be seeing a wave ((B)) bounce then another leg lower in wave ((C)).
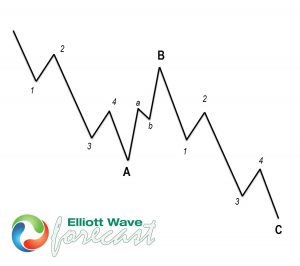
Elliott Wave ZigZag Structure
You can learn more about Elliott Wave Patterns at our Free Elliott Wave Educational Web Page
Remember, the market is dynamic, so the presented view may have changed in the meantime. You can also ask for live updates in our Live Trading Room, where our expert analysts provide next buying opportunity based on new market data.
WMT Daily Elliott Wave Chart
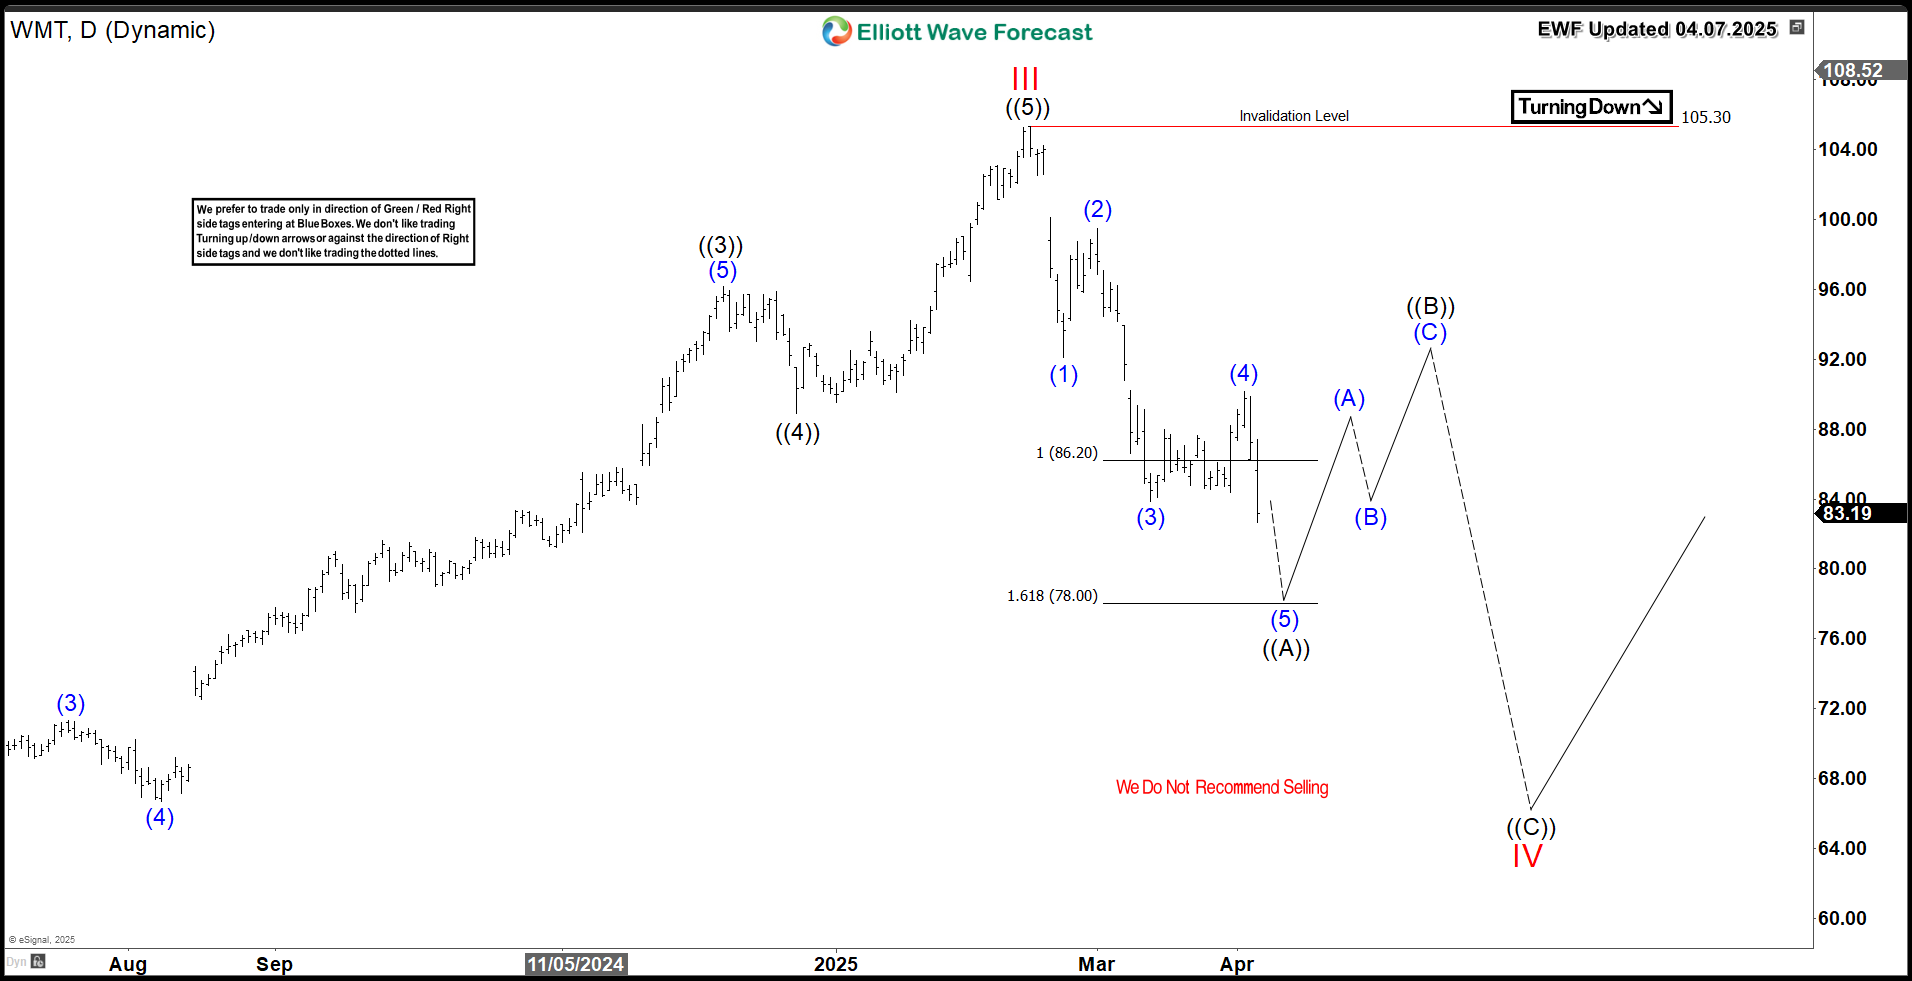
The above chart shows WMT trading within the equal legs area of $86-$78, where it may complete the 5-wave decline. However, impulsive declines often extend beyond the 1.618 Fibonacci extension. Hence, buying at this stage during the bounce in wave ((B)) is not advisable. As the daily correction progresses, Walmart may aim to revisit its August 2024 low near the $66 mark.. Therefore, it is better to wait for the market to establish a clear connector before identifying the next buying opportunity.
In conclusion, the sharp impulsive decline indicates that the upcoming bounce is likely to fail. Walmart (WMT) may see further downside ahead. The preferred strategy is to consider buying the stock after it forms a 3, 7, or 11 swings sequence from the peak. Using our extreme Blue Box System will help identify the optimal entry points, providing clarity and precision in your trading decisions. Explore our system to gain deeper insights into this methodology.
면책 조항: 본 게시글에 표현된 견해는 전적으로 작성자의 견해이며 Followme의 공식 입장을 대변하지 않습니다. Followme는 제공된 정보의 정확성, 완전성 또는 신뢰성에 대해 책임을 지지 않으며, 서면으로 명시적으로 언급되지 않는 한 해당 내용을 기반으로 취해진 어떠한 조치에 대해서도 책임을 지지 않습니다.

