


Understanding Fortinet’s Long-Term Growth Potential Through Elliott Wave Analysis
Fortinet Inc. (FTNT) remains in a long-term bullish cycle, with Elliott Wave analysis signaling further upside. The stock recently completed a significant correction and appears ready for the next move higher.
Weekly Elliott Wave Analysis:
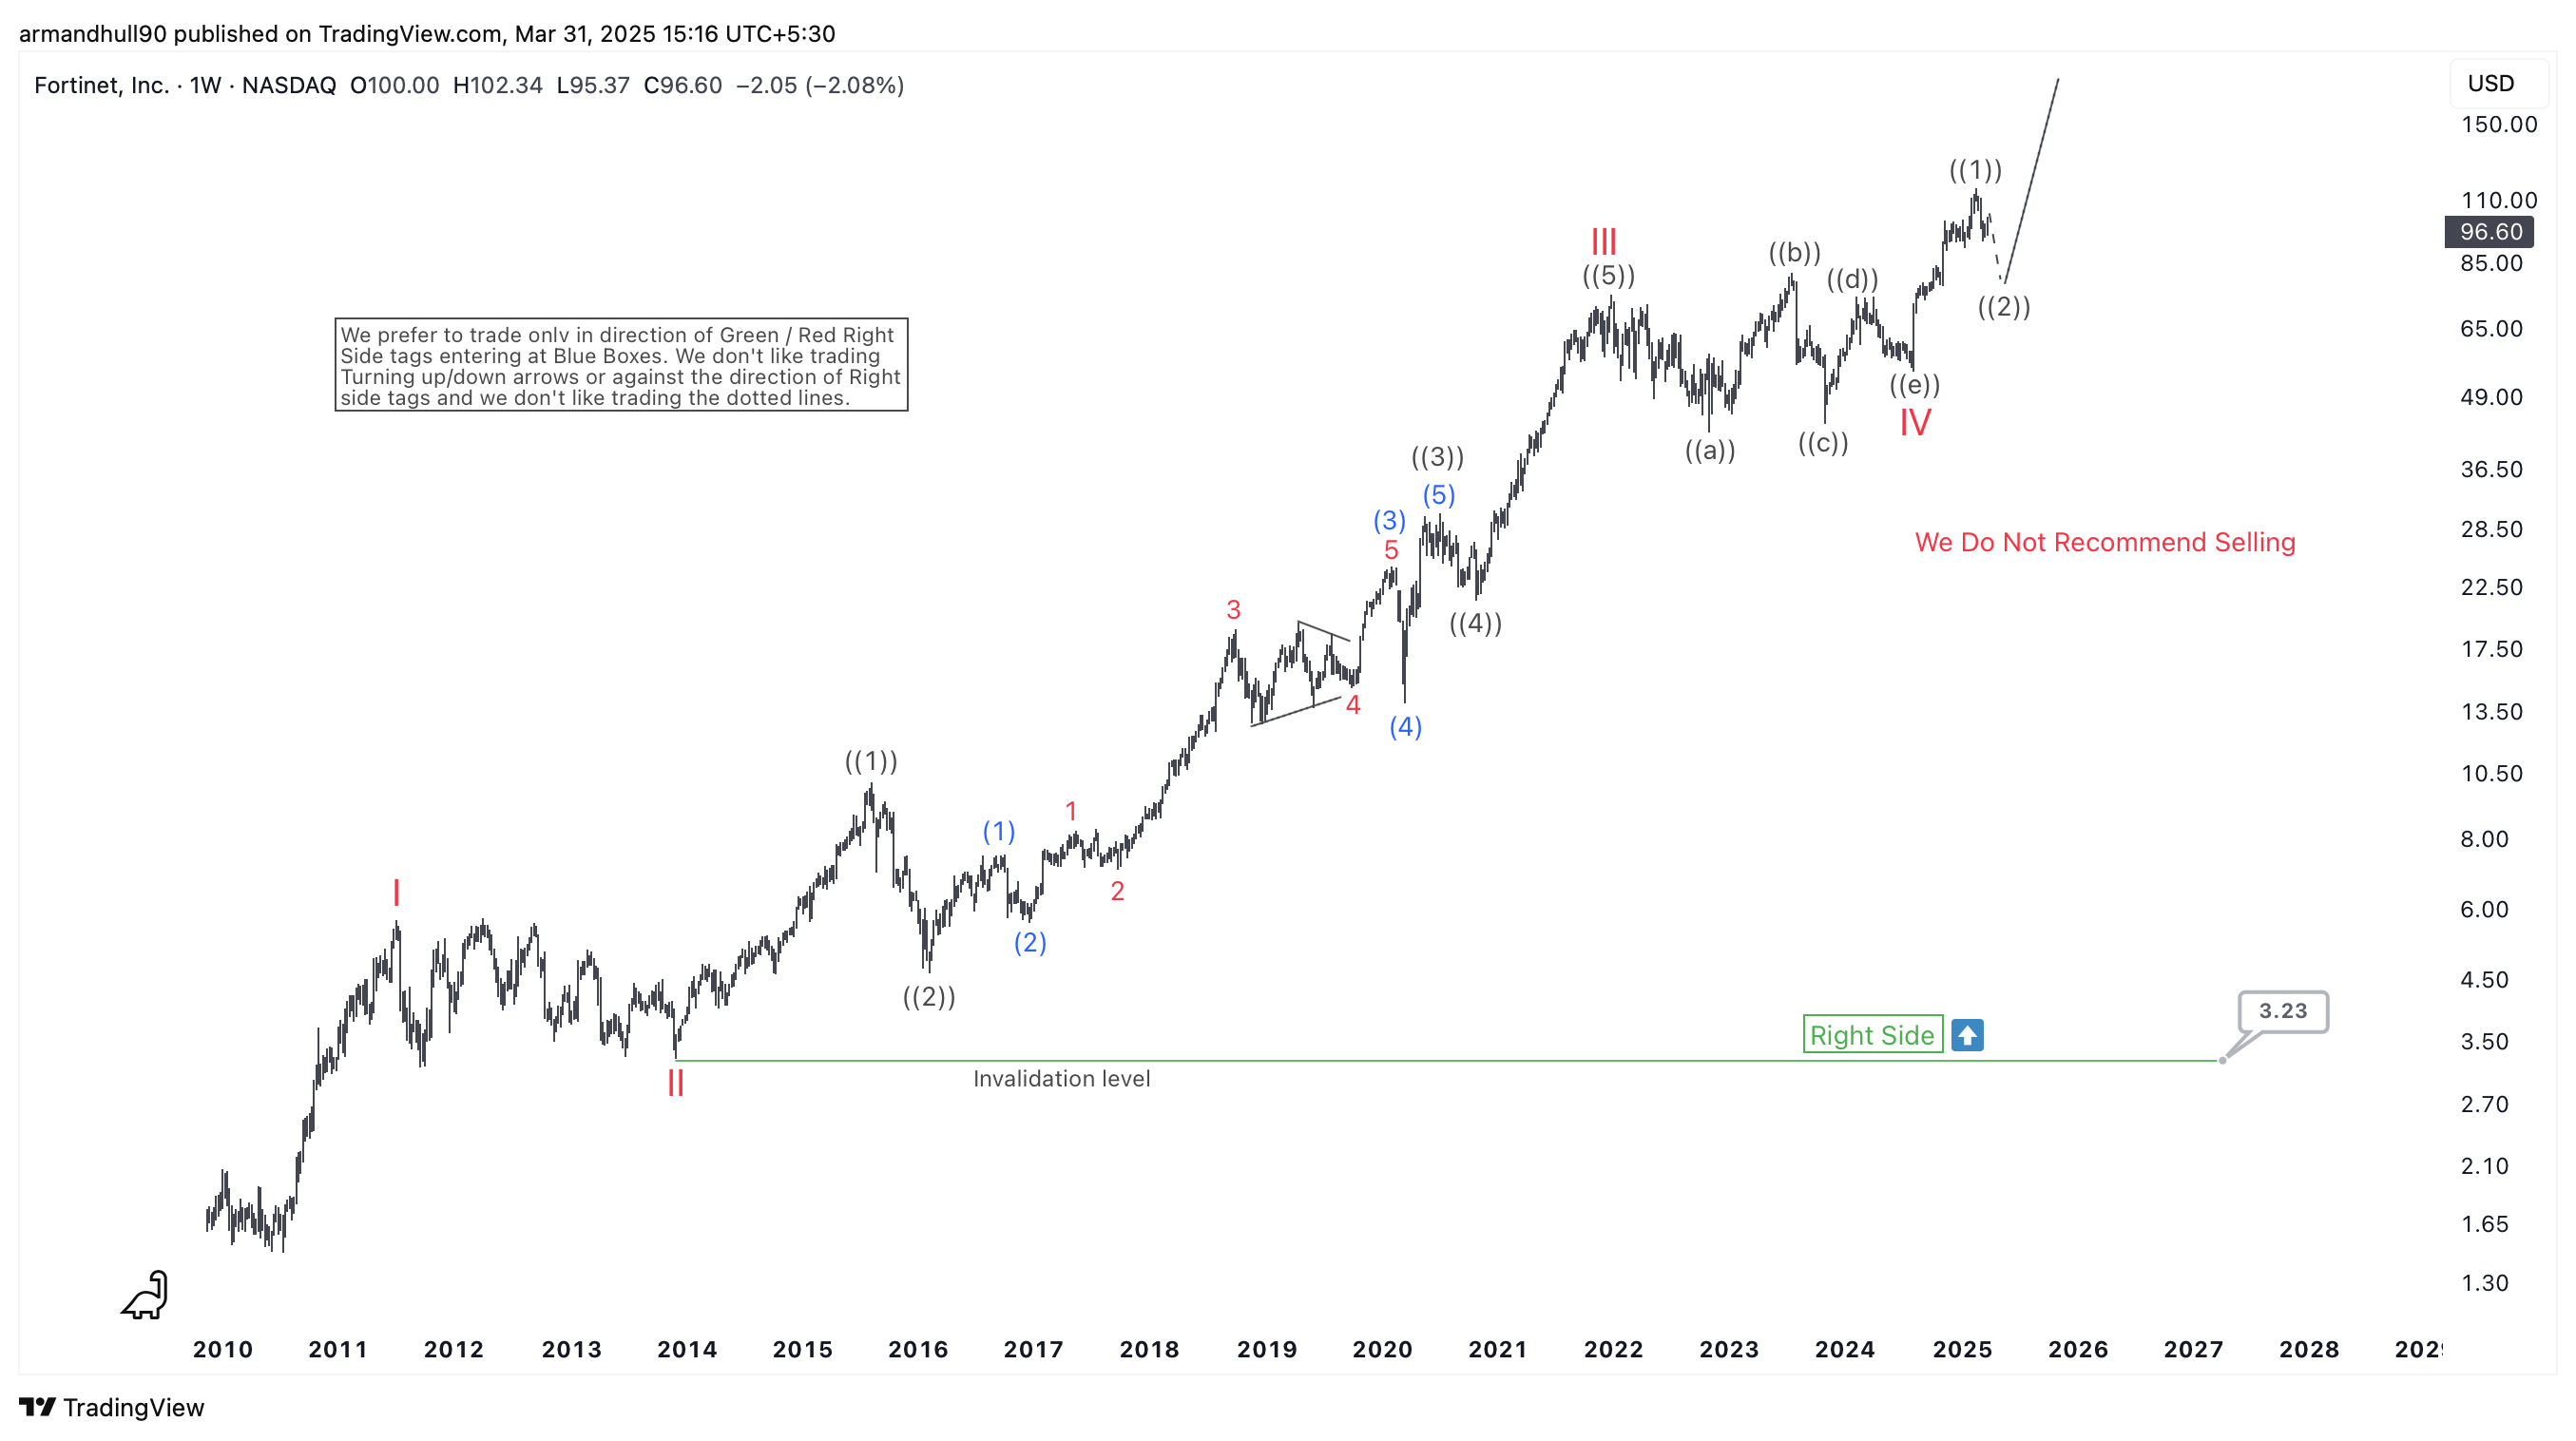
The weekly chart of FTNT highlights a clear five-wave impulsive advance, which completed wave III at a peak in 2022. Afterward, the stock entered a complex corrective phase, labeled as wave IV. This correction found support near $54.54, aligning with key Fibonacci retracement levels. With this correction now over, FTNT has begun a new bullish cycle.
Short-term Elliott Wave Outlook:
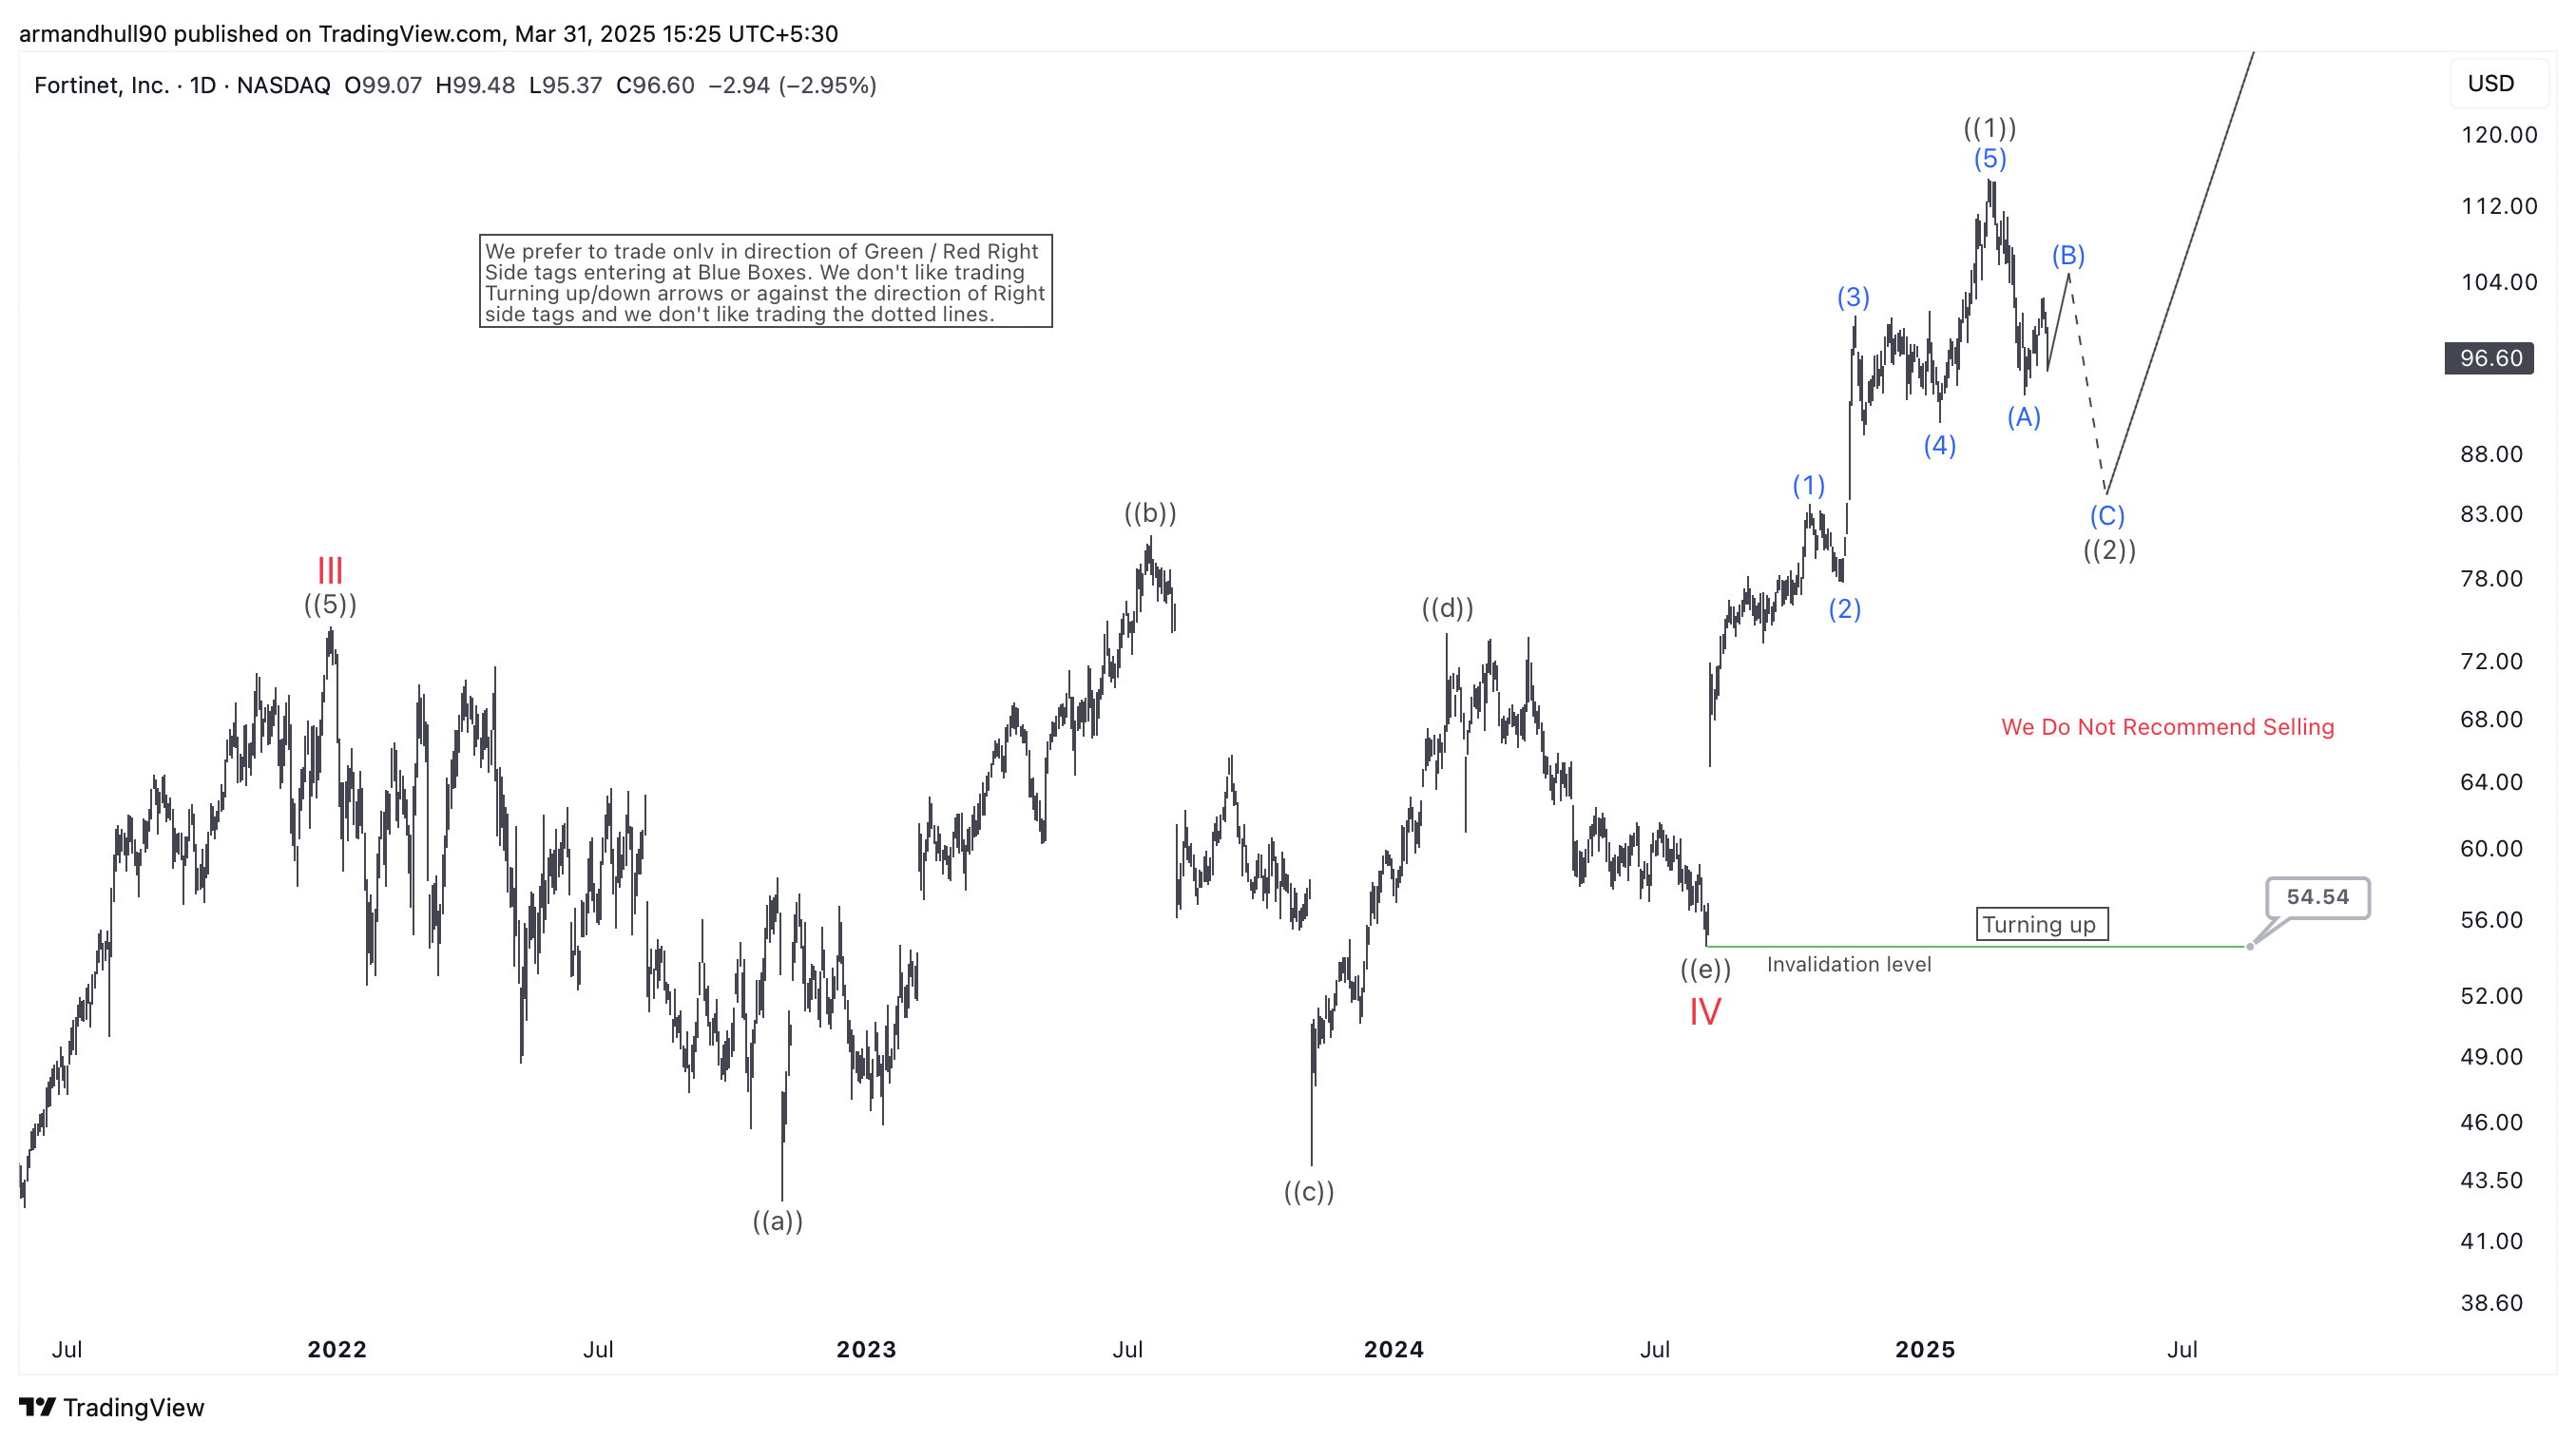
On the daily timeframe, FTNT has already completed an initial five-wave advance, marking wave ((1)) of a new uptrend. Currently, the stock is experiencing a wave ((2)) pullback, which is expected to be fail in 3, 7 or 11 swings above the low of wave IV in the near term. Once this phase concludes, another strong rally should follow. The projected target for wave ((3)) lies between $120 and $150, indicating substantial upside potential.
Right Side and Trading Strategy
The "Right Side" tag confirms the primary trend is bullish. Traders should focus on buying opportunities rather than shorting. The bullish outlook stays valid as long as FTNT holds above $54.54.
The "Turning Up" tag indicates that the stock is resuming its uptrend. Traders can look for pullbacks as potential entry points while managing risk carefully.
Conclusion
Fortinet Inc. remains structurally bullish, with wave ((3)) likely to accelerate higher. Investors should consider buying on pullbacks while watching the $54.54 support level. With a strong Elliott Wave setup, FTNT is well-positioned to reach new highs in the coming months.
면책 조항: 본 게시글에 표현된 견해는 전적으로 작성자의 견해이며 Followme의 공식 입장을 대변하지 않습니다. Followme는 제공된 정보의 정확성, 완전성 또는 신뢰성에 대해 책임을 지지 않으며, 서면으로 명시적으로 언급되지 않는 한 해당 내용을 기반으로 취해진 어떠한 조치에 대해서도 책임을 지지 않습니다.

