


The world’s largest dedicated semiconductor foundry Taiwan Semiconductor Manufacturing (NYSE: TSM) is down 25% from January peak. However, we’ll be looking at the Elliott Wave structure within the weekly daily cycles and we'll explain why we believe it's the right time to buy the stock.
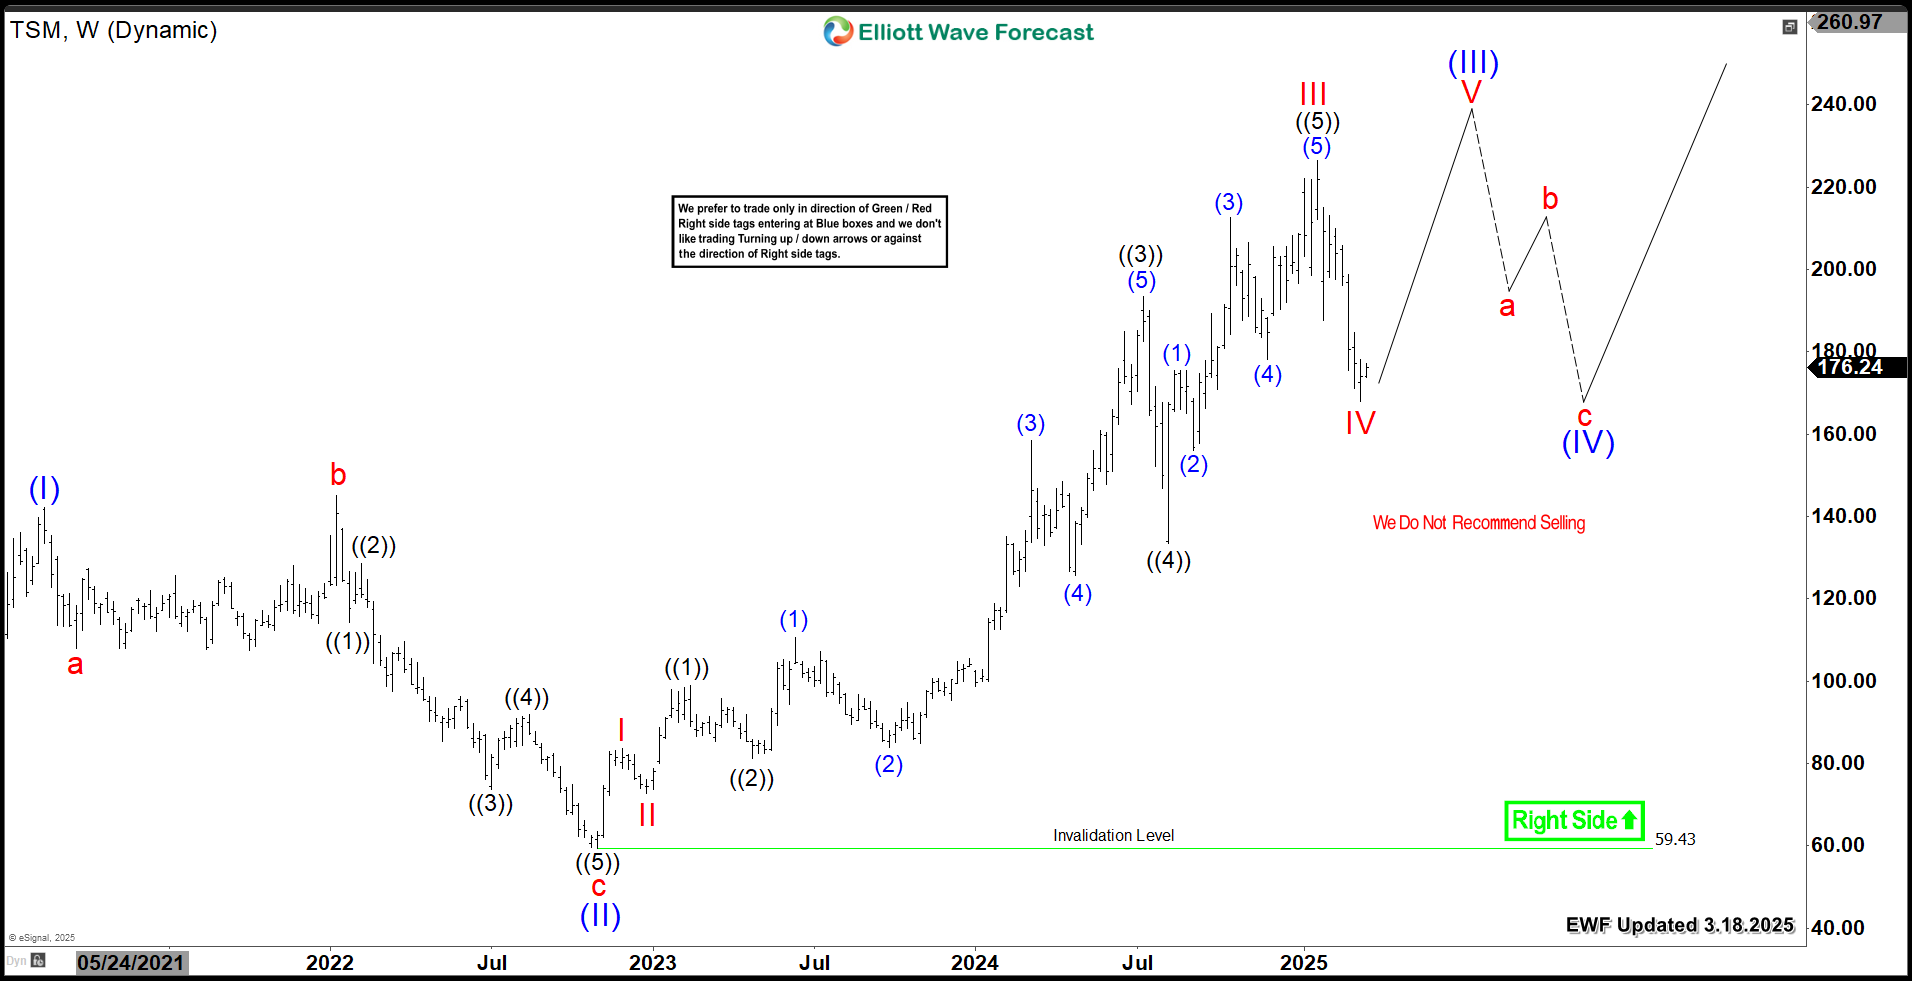
Looking at the weekly chart for TSM, It is showing an impulsive 3 waves move into new all-time highs. Wave I peak was in 2021 followed a 3 waves Flat structure in wave II ending in 2022. After that, the stock started the current rally in progress within wave (III) which is still looking for wave V before seeing a larger degree correction in wave (IV). Moreover, we consider the rally from all time lows as an incomplete bullish sequence missing 2 more swings before ending the entire cycle.
TSM Weekly Chart 3.18.2025
In the following daily chart, we see TSM decline from January 2025 peak unfolding within a corrective 3 waves ZigZag structure. That is to say, we expect the stock to find buyers in wave IV pullback in 3 , 7 or 11 swings. It already reached our buying Blue Box area at equal legs $176 - $152 and we the stock to react higher from there.
TSM will bounce from the mentioned area to start the rally in wave V and it will aim for a minimum target at $240 - $262. However if the stock fails to make new all time highs then it will correct lower within a double three structure.
TSM Daily Chart 3.18.2025
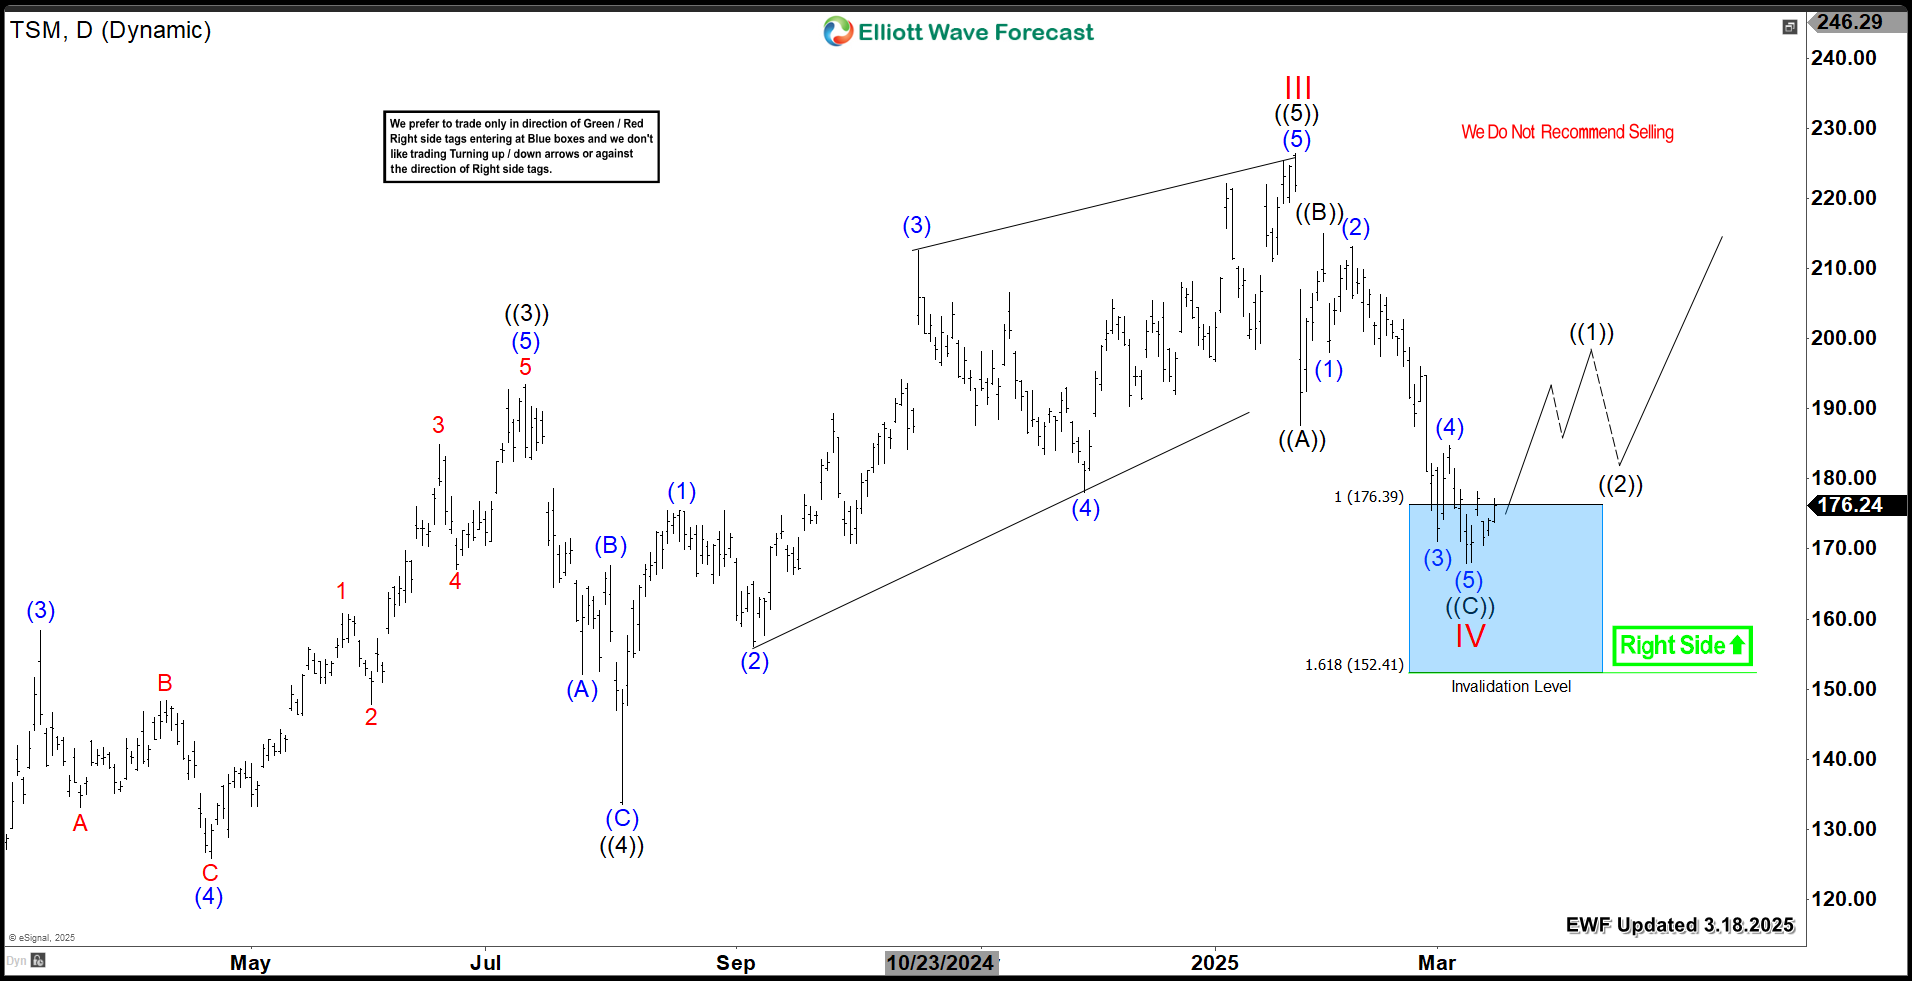
In conclusion, TSM weekly cycle is still bullish and consequently we favor buying the current daily correction within our Blue Box which is a High-frequency area where the market is likely to end cycles and make a turn.
면책 조항: 본 게시글에 표현된 견해는 전적으로 작성자의 견해이며 Followme의 공식 입장을 대변하지 않습니다. Followme는 제공된 정보의 정확성, 완전성 또는 신뢰성에 대해 책임을 지지 않으며, 서면으로 명시적으로 언급되지 않는 한 해당 내용을 기반으로 취해진 어떠한 조치에 대해서도 책임을 지지 않습니다.

