


In the last two days, RGTI has had a strong fall, losing more than 50% of its value. The stock ended a cycle and began a correction. Now we are going to see what could happen to the Quantum technology company, from where it can rebound and the pivots that will tell us if the market will return to November 2024 values.
RGTI 30 Min Chart 12.26.2024
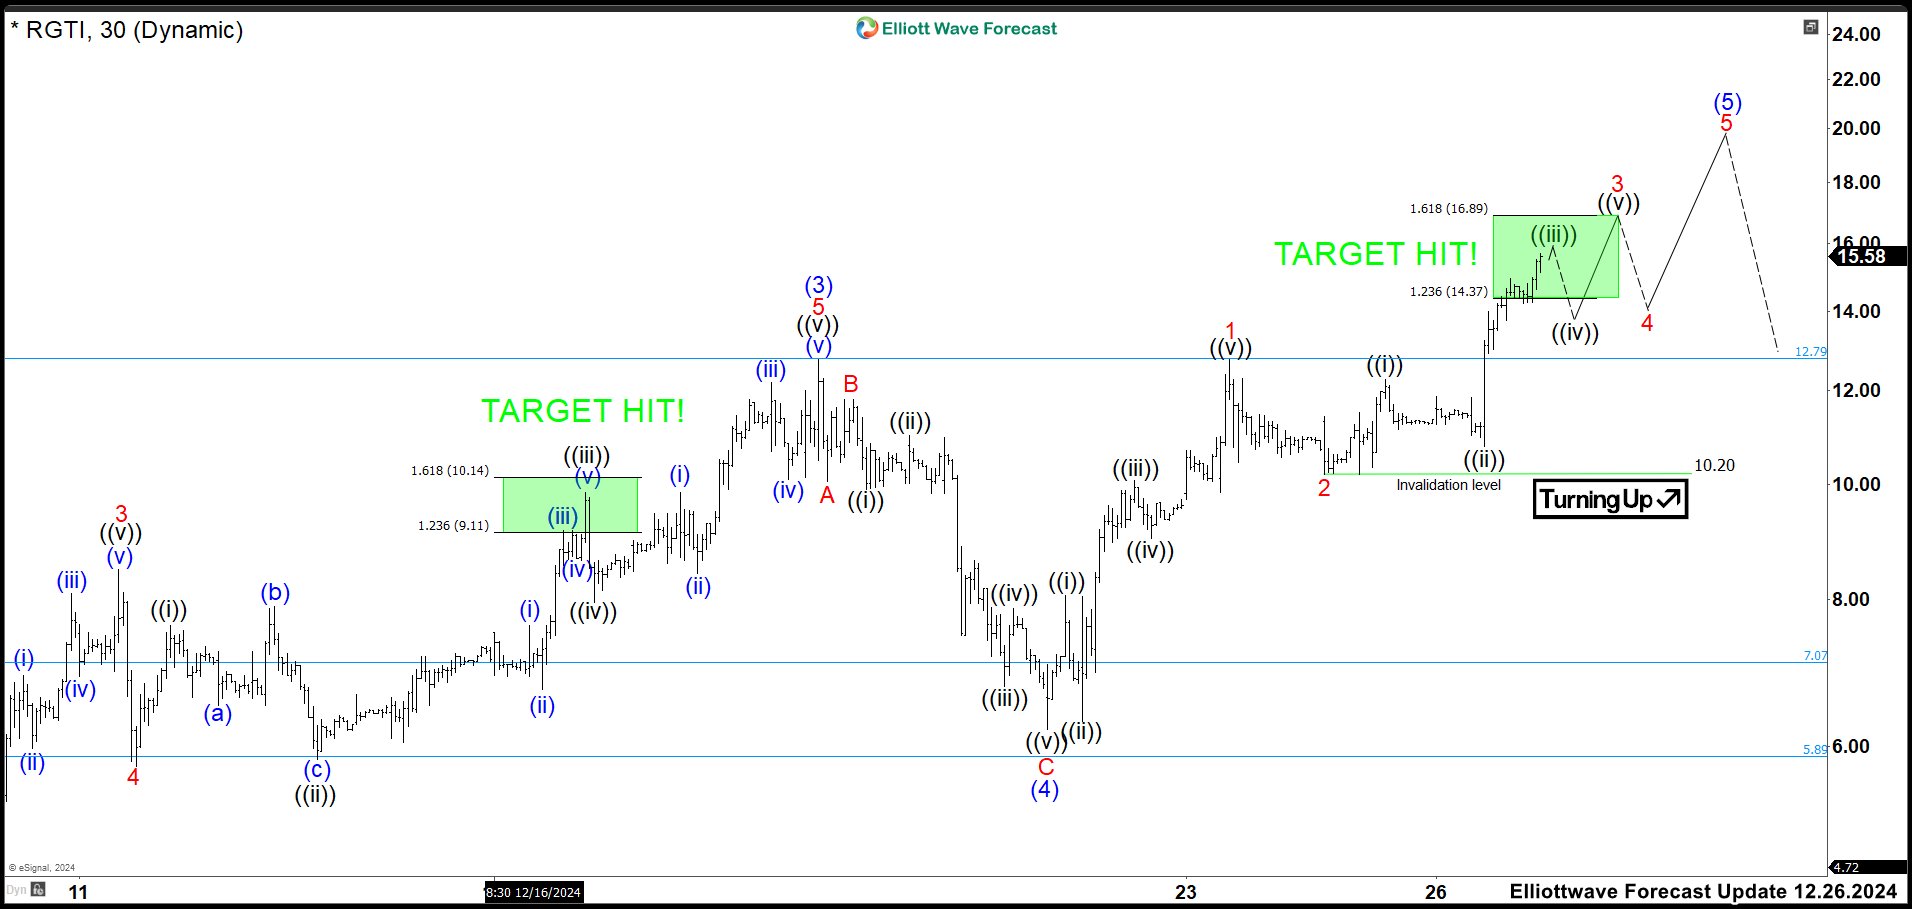
This is the last chart from December 26th where we hit target and wave (5) looked like was going to extend higher. We can see how wave 1 ended at 12.79 high and the market did a small pullback as wave 2 to 10.20 low. The wave 3 started hitting our target area of 14.37 - 16.89 calling for more upside. Therefore, we expected that the market should continue moving sideway to higher until it ends wave 3. Then, wave 4 correction should retest around the low of wave ((iv)) and finally, a last push higher should end wave 5 of (5) before seeing a retracement in 3, 7 or 11 swings correction.
RGTI 60 Min Chart 01.08.2025
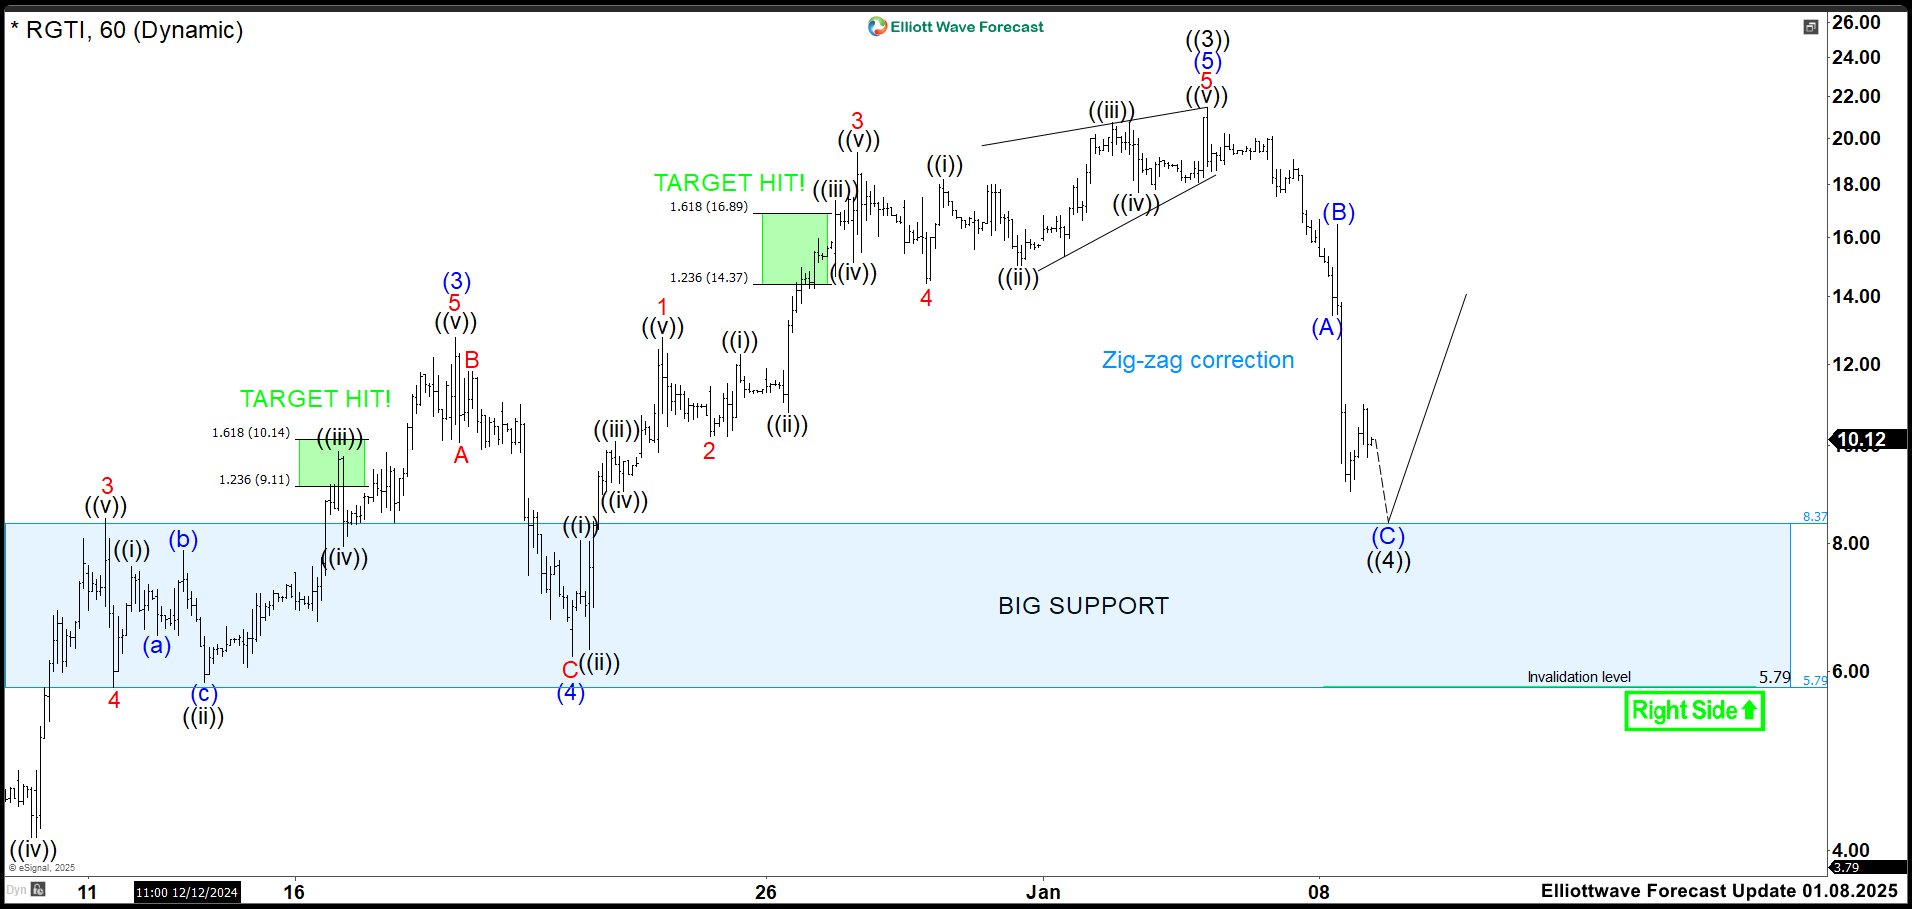
This is the lastest chart of RGTI. We can see how wave 3 ended at 19.35 high and pullback as wave 4 at 14.40 low. The stock continued higher developing wave 5 as an ending diagonal structure. After 5 swings the structure completed at 21.42 high. Also ended wave (5) in higher degree and possible wave ((3)) in higher degree.
In a post of Jan 2nd by @ElliottForecast, we suggested the area where we should see a reaction lower. Here is the post: "$RGTI has rallied higher and it should continue to 20.50 - 22.33 area. If we see a reaction lower from this zone, a cycle could have ended and we will expect 3, 7 or 11 swings correction before resuming to the upside. If there is not reaction, it should continue extending higher."
Once an ending diagonal is completed, it is a big warning because a strong pullback is possible. We can see the stock has broken down losing more than 50% of its value. Looks like is building a zig zag correction at the moment, but it is too early to tell certainly. If this move is a wave ((4)), we have a huge support. We consider a support area of 8.37 - 5.79. We should see a bounce in this area to continue the rally and break above 21.42 high. However, if the stock closed a day market below this area, it is dangerous because it could return to levels of November 2024. Let see what the structures give us next days. Trade safe!
면책 조항: 본 게시글에 표현된 견해는 전적으로 작성자의 견해이며 Followme의 공식 입장을 대변하지 않습니다. Followme는 제공된 정보의 정확성, 완전성 또는 신뢰성에 대해 책임을 지지 않으며, 서면으로 명시적으로 언급되지 않는 한 해당 내용을 기반으로 취해진 어떠한 조치에 대해서도 책임을 지지 않습니다.

