


SoFi Technologies, Inc., (SOFI) provides various financial services in the US, Latin America & Canada. It operates through three segments; Lending, Technology Platform & Financial services. It comes under Financial Services sector & trades as “SOFI” ticker at Nasdaq.
In last article, SOFI favors rally in (3), which ended at $17.19 high & favors corrective pullback in (4). It dropped in 5 swings in A & favors downside in C of (4) towards $14.08 - $12.47 area.
SOFI - Elliott Wave Latest Daily View: 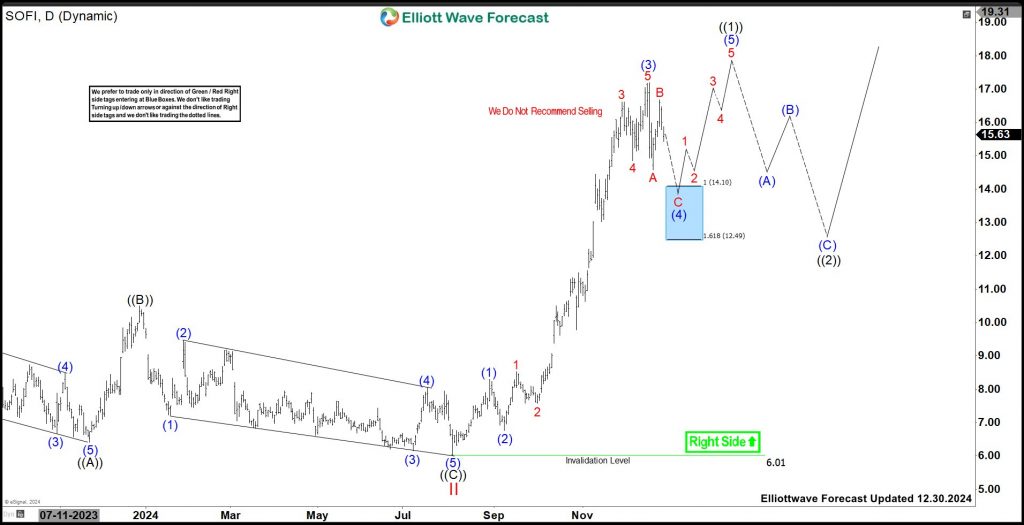
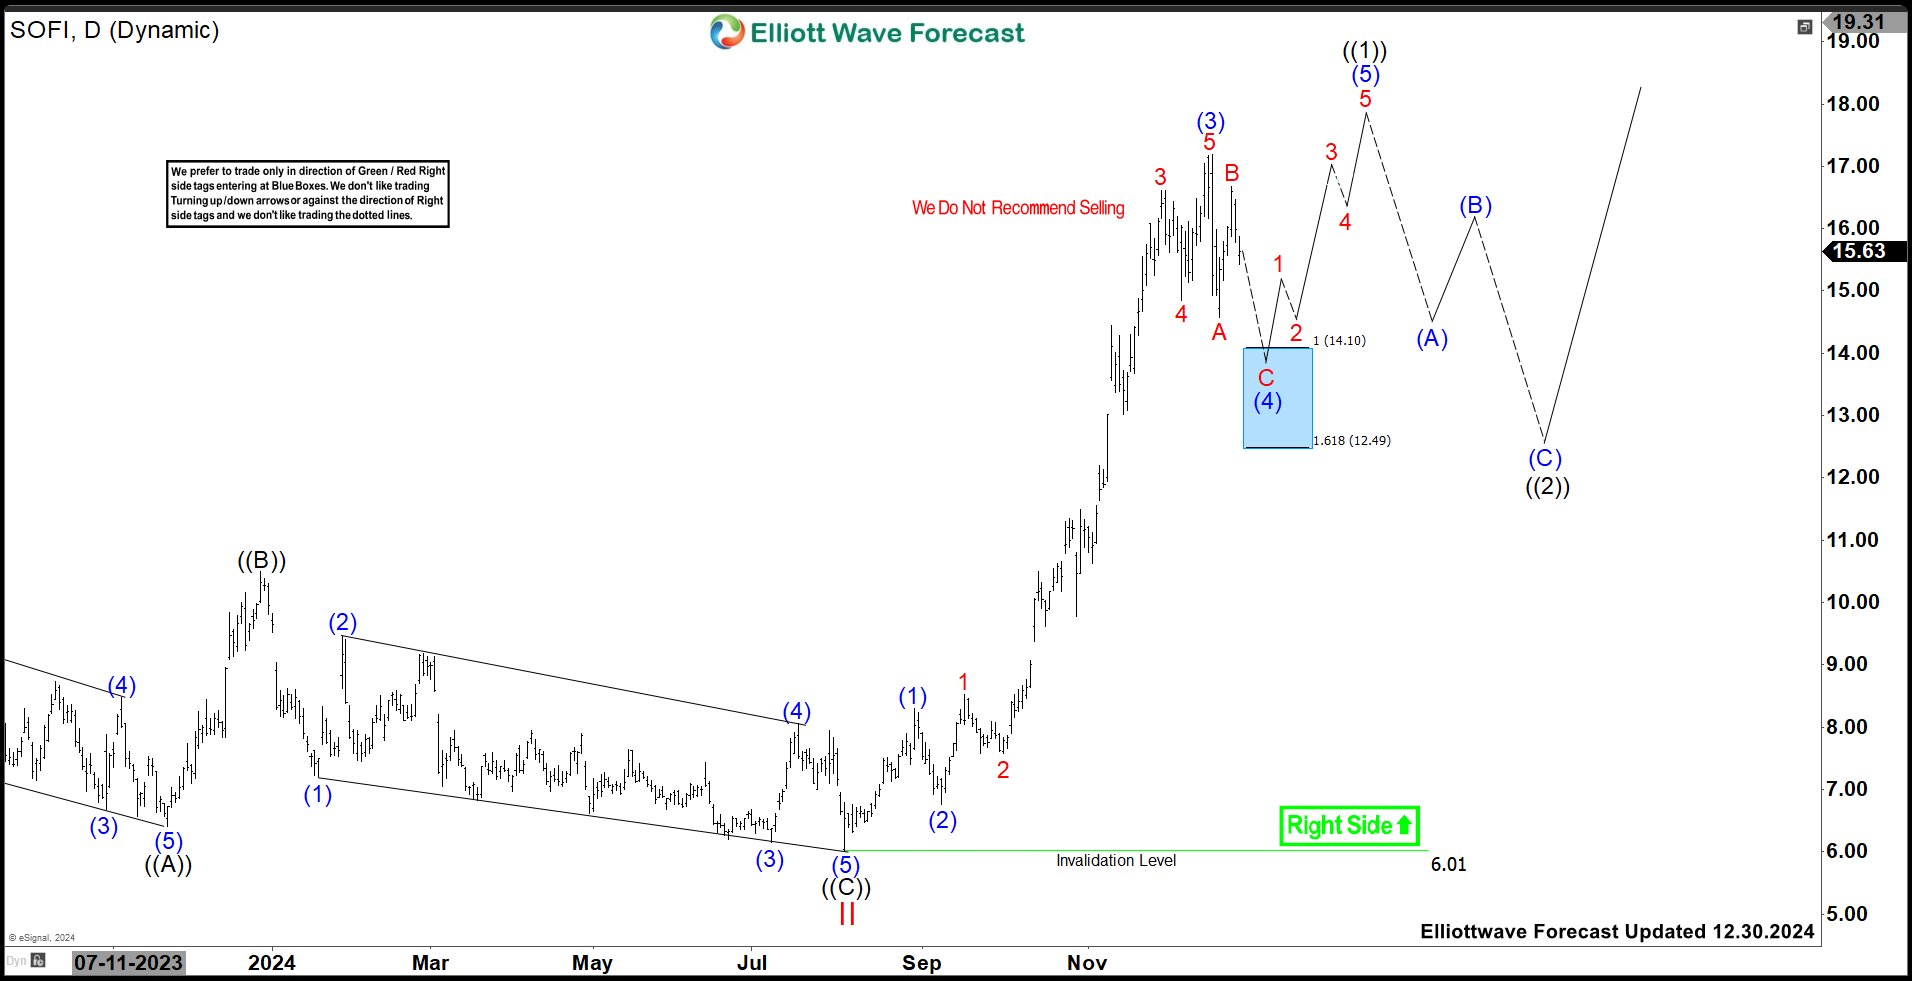
It made all time low at $4.24 in December-2022 & then resume higher. It placed I as impulse bullish sequence at $11.70 high in July-2023 started from August-2022 low as diagonal. It ended corrective pullback in II as zigzag correction at $6.01 low in August-2024 low. Within II, it placed ((A)) at $6.41 low, ((B)) at $10.49 high & ((C)) at $6.01 low in zigzag structure. Above $6.01 low, it resumes rally in ((1)) of III & expect one more push higher to finish it.
SOFI - Elliott Wave View From 11.18.2024: 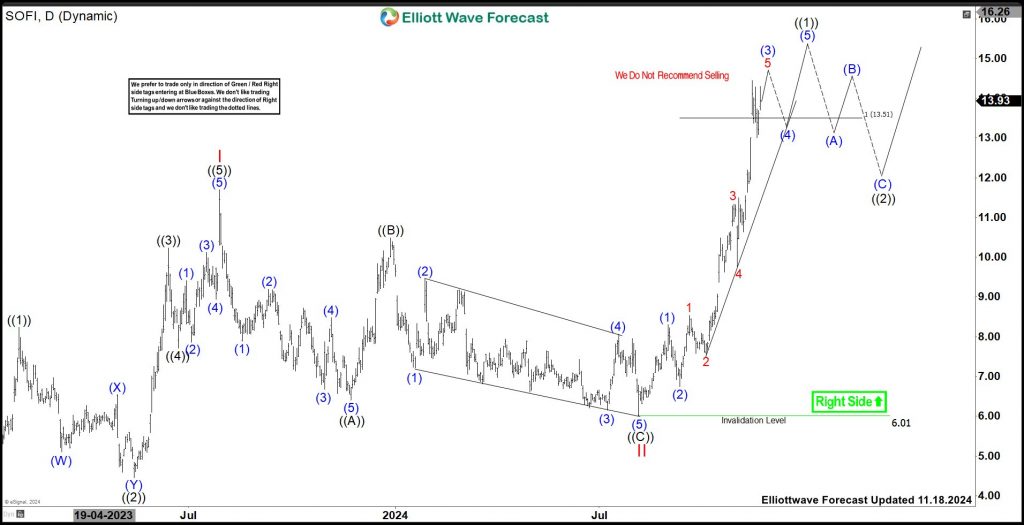
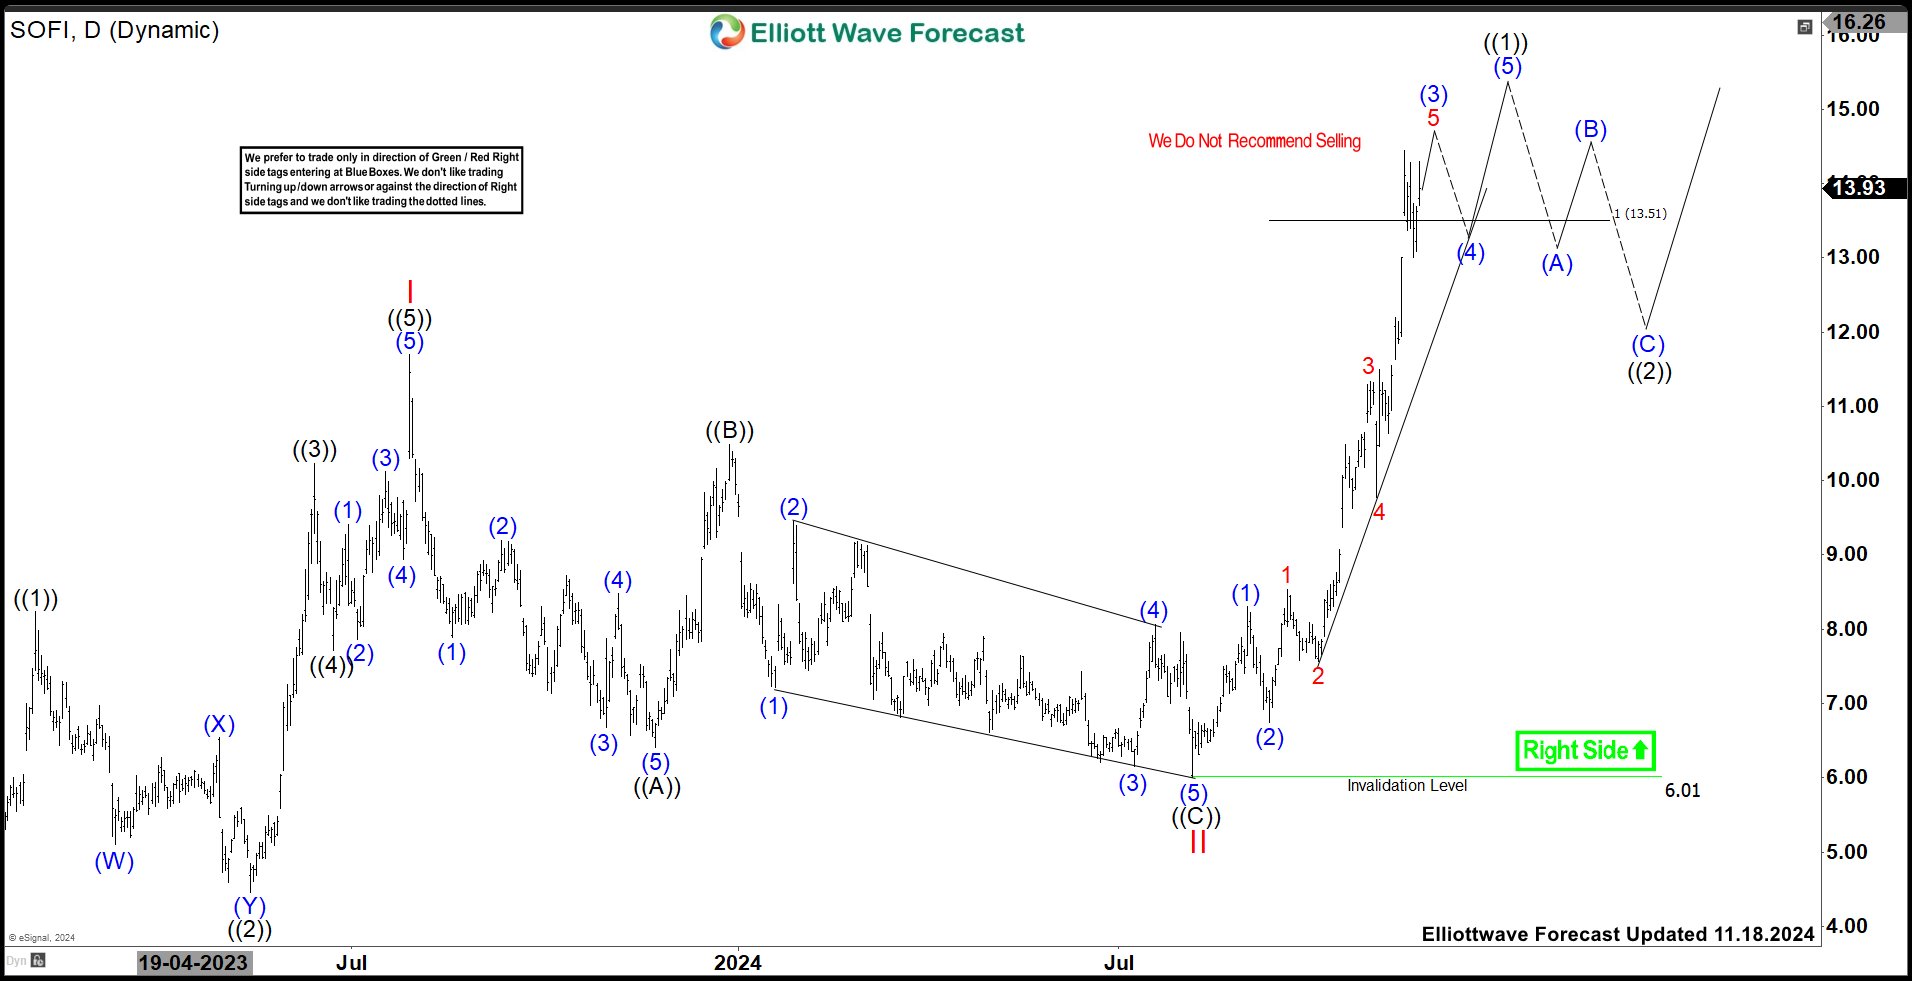
Within ((1)), it placed (1) at $8.30 high, (2) at $6.75 low & (3) as extended wave ended at $17.19 high. It subdivided (3) as 1 ended at $8.53 high, 2 at $7.57 low, 3 at $16.61 high, 4 at $14.85 low & finally 5 at $17.19 high. Currently, it favors pullback in (4) in zigzag & remain choppy to lower towards blue box area, which provide buying opportunity for (5) or at least 3 swing bounce. Within (4), it placed A at $14.58 low as 5 swings down & B at $16.68 high. Below there, it favors lower in C towards $14.08 - $12.47 area to finish (4) before resume higher.
면책 조항: 본 게시글에 표현된 견해는 전적으로 작성자의 견해이며 Followme의 공식 입장을 대변하지 않습니다. Followme는 제공된 정보의 정확성, 완전성 또는 신뢰성에 대해 책임을 지지 않으며, 서면으로 명시적으로 언급되지 않는 한 해당 내용을 기반으로 취해진 어떠한 조치에 대해서도 책임을 지지 않습니다.

