Hello traders. Welcome to another blog post where we share how members of Elliottwave-Forecast trade using the Elliott wave theory. In this post, the spotlight will be on the Bank of America Corporation BAC, which has the ticker $BAC.
BAC is one of the stocks still recovering from the 2008 global financial crisis. After plunging to nearly $2.50, it bottomed out in May 2009. Before the crash, the stock reached an all-time high of around $55 in November 2006. Since then, BAC has shown a clear bullish sequence from its 2009 low. However, it has yet to reclaim its previous record high. A new peak could be within reach if the price surpasses the January 2022 high.
We are bullish on this stock due to its evident bullish sequence from the 2009 low. Our strategy involves buying pullbacks when they complete zigzag, double zigzag, or triple zigzag structures. In this post, we’ll focus on a double zigzag pattern we traded earlier in December 2024 on the H1 chart.
BAC Elliott Wave Analysis, 12.05.2024 Update
[caption id="attachment_952117" align="aligncenter" width="1024"]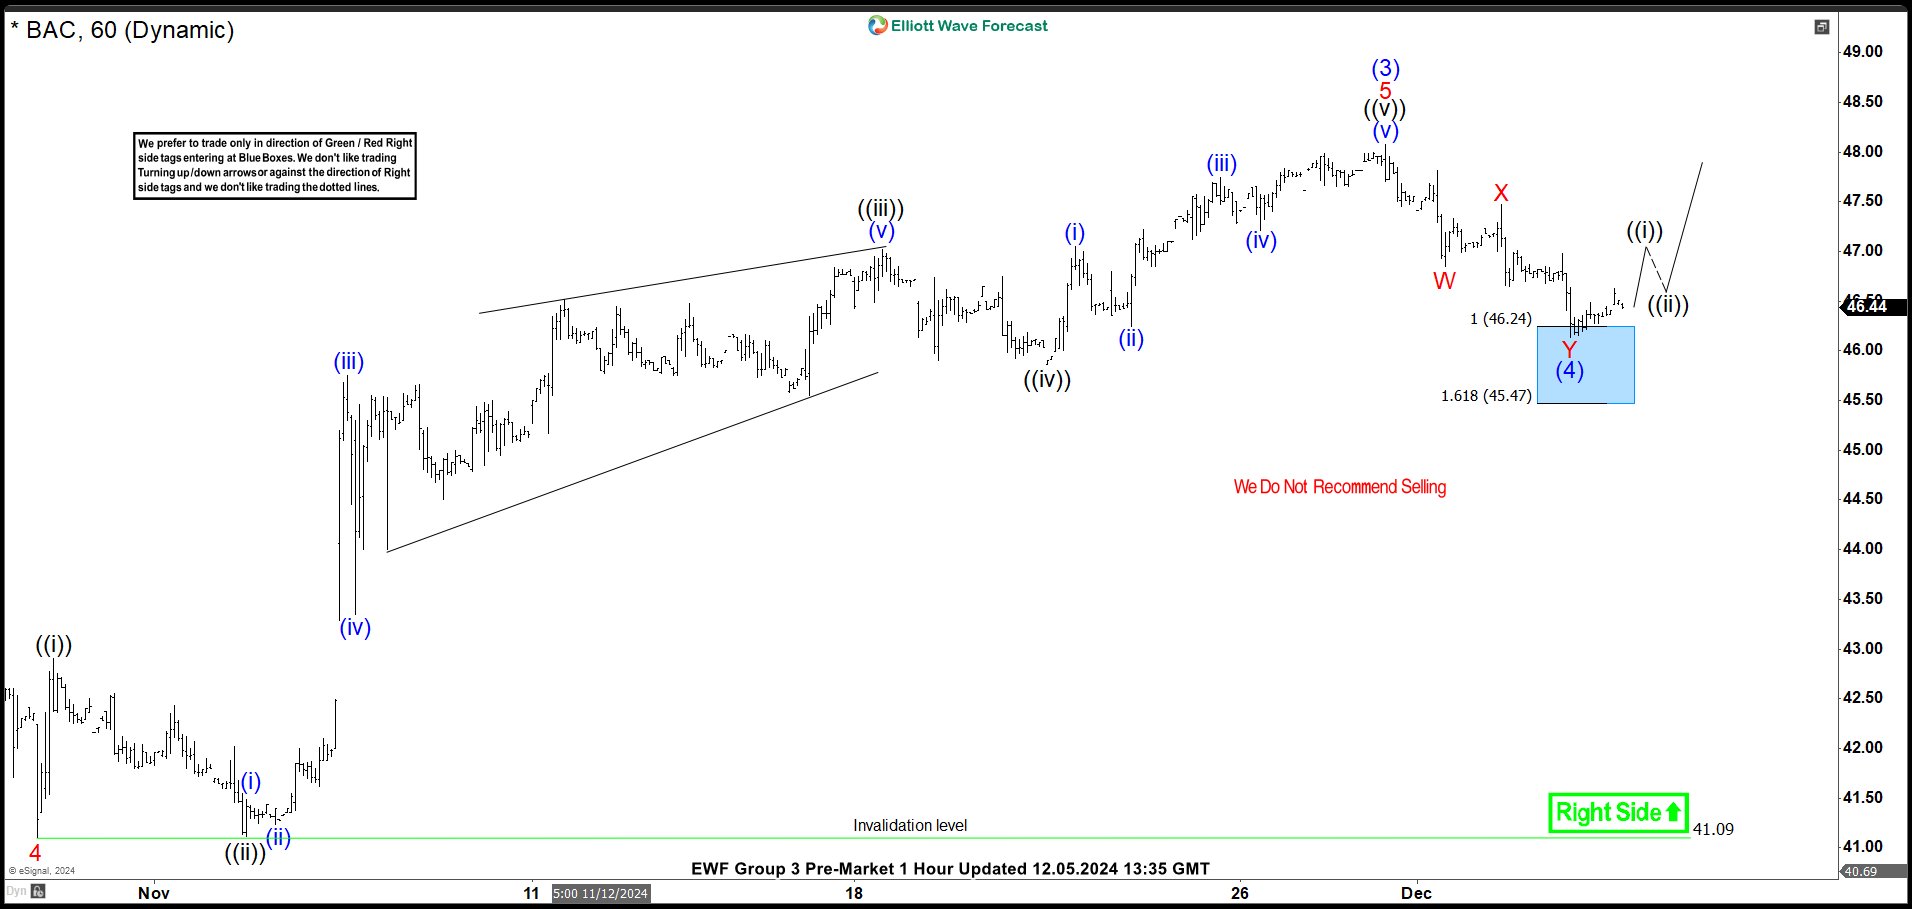 BAC, H1 Chart[/caption]
In late November, the price completed wave (3), forming a full bullish impulse sequence. We planned to buy in wave (4) if the pullback unfolded as a 3-swing or 7-swing structure (zigzag or double zigzag). As anticipated, the pullback began as a 7-swing structure.
We identified the extreme area and shared the blue box with members. This blue box highlighted the ideal zone for placing long orders and setting a stop loss. On December 5, 2024, we shared the updated chart, showing the stock finding support within the blue box as expected.
Following our trade management rules, we took partial profits when the price reached 50% of wave Y of (4). We refer to this as the "risk-free area," where we also adjusted the stop loss of the remaining trade to breakeven.
BAC Elliott Wave Analysis, 12.06.2024 Update
[caption id="attachment_952116" align="aligncenter" width="1024"]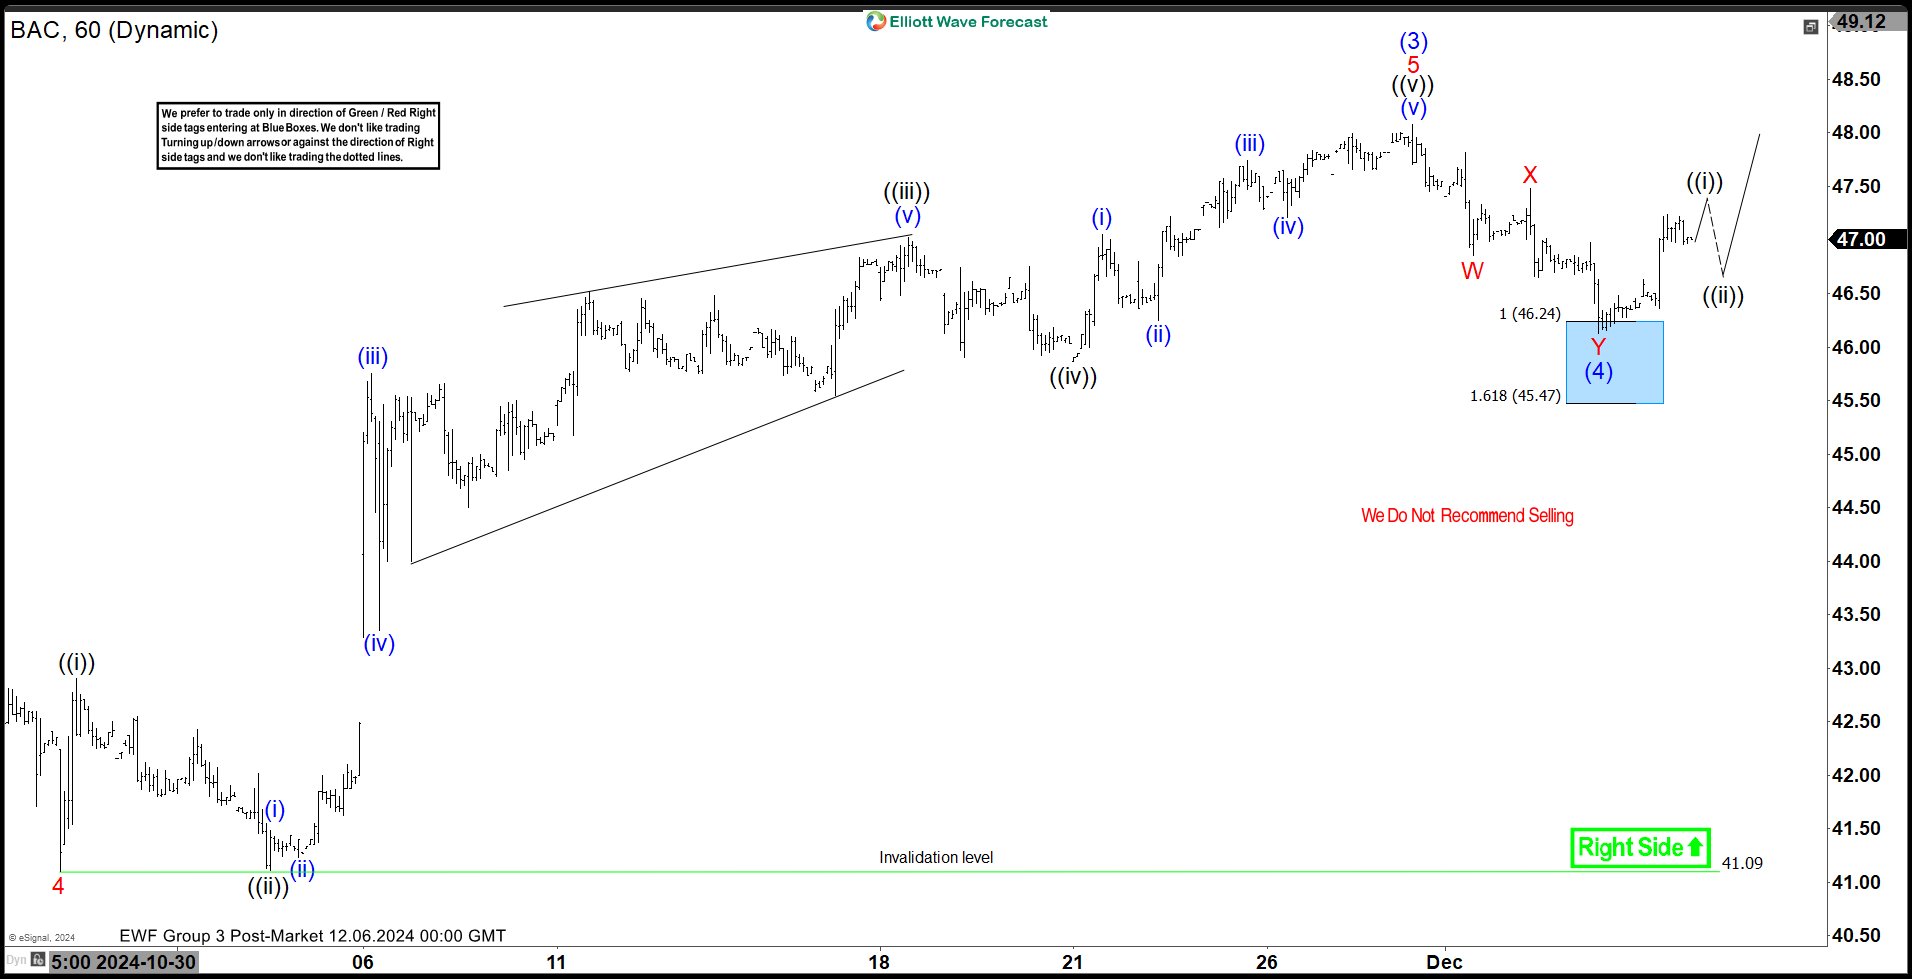 BAC, H1 Chart[/caption]
A day after reaching the blue box, the price rallied sharply beyond the risk-free area (50% of wave Y of (4)). This gave members the opportunity to take partial profits while keeping the rest of the trade at breakeven. On December 6, 2024, we shared the updated chart with members, confirming the rally.
With no further risk, buyers can now hold the remaining position to capitalize on wave (5). For this stock, we continue to favor buying pullbacks as it moves toward a fresh record high.
면책 조항: 본 게시글에 표현된 견해는 전적으로 작성자의 견해이며 Followme의 공식 입장을 대변하지 않습니다. Followme는 제공된 정보의 정확성, 완전성 또는 신뢰성에 대해 책임을 지지 않으며, 서면으로 명시적으로 언급되지 않는 한 해당 내용을 기반으로 취해진 어떠한 조치에 대해서도 책임을 지지 않습니다.

더 오래된 의견은 없습니다. 소파를 가장 먼저 잡으십시오.