Hello fellow traders. In this technical article we’re going to take a quick look at the weekly Elliott Wave charts of QQQ Invesco NASDAQ ETF, published in members area of the website. As many of our members are aware, the ETF is forming impulsive 5 waves rally in the cycle from the 420 low and it has given us good buying opportunities recently. QQQ made another pull back that reached extreme zone from the peak completed a correction at the Equal Legs (Blue Box Area). In the following sections, we’ll take a look into the Elliott Wave pattern and our forecast.
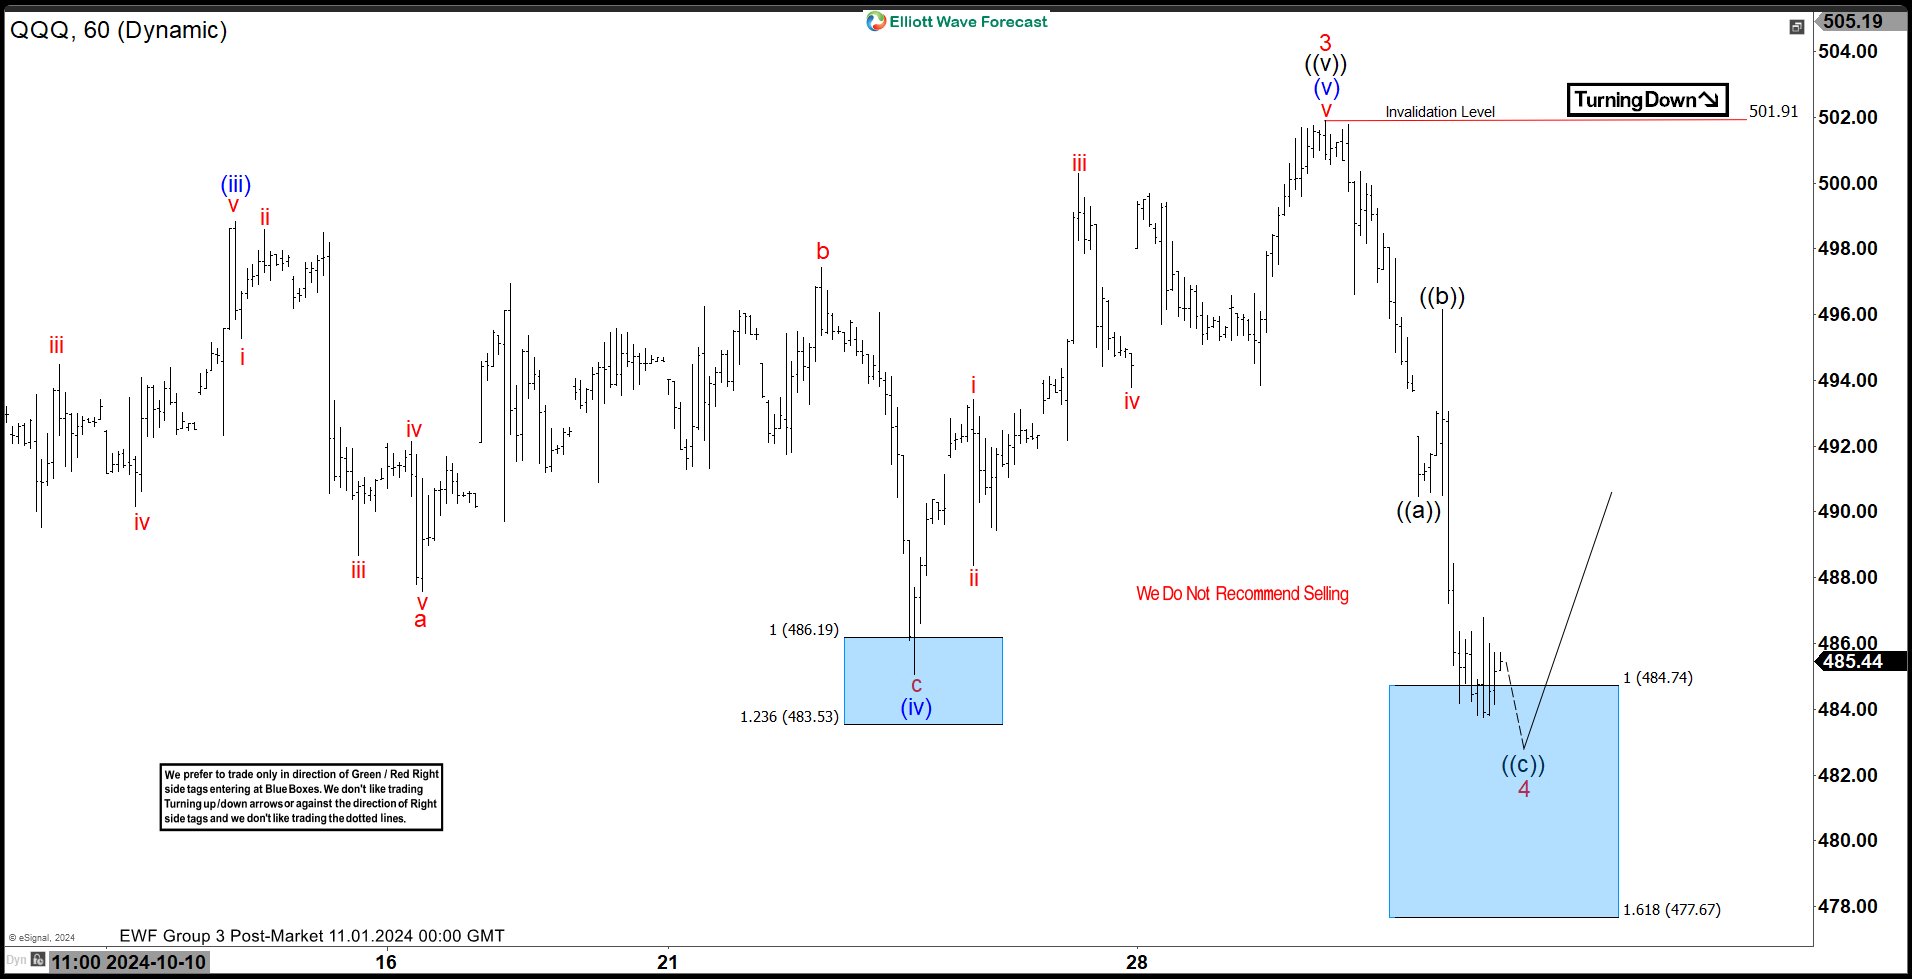
QQQ H1 Update 11.01.2024
ETF is giving us correction that is unfolding as 3 waves pattern , labeled as (((a))((b))((c)) black. The pullback has already reached the extreme zone (Blue Box) . However we expect to see another marginal push down in near term. At this stage, we advise against selling the ETF and expect buyers to appear at the marked Blue Box area. QQQ could either see a rally to new highs or a corrective bounce in at least three waves.
If you want to learn more about Elliott Wave Patterns, we invite you to explore our Free Elliott Wave Educational Web Page.
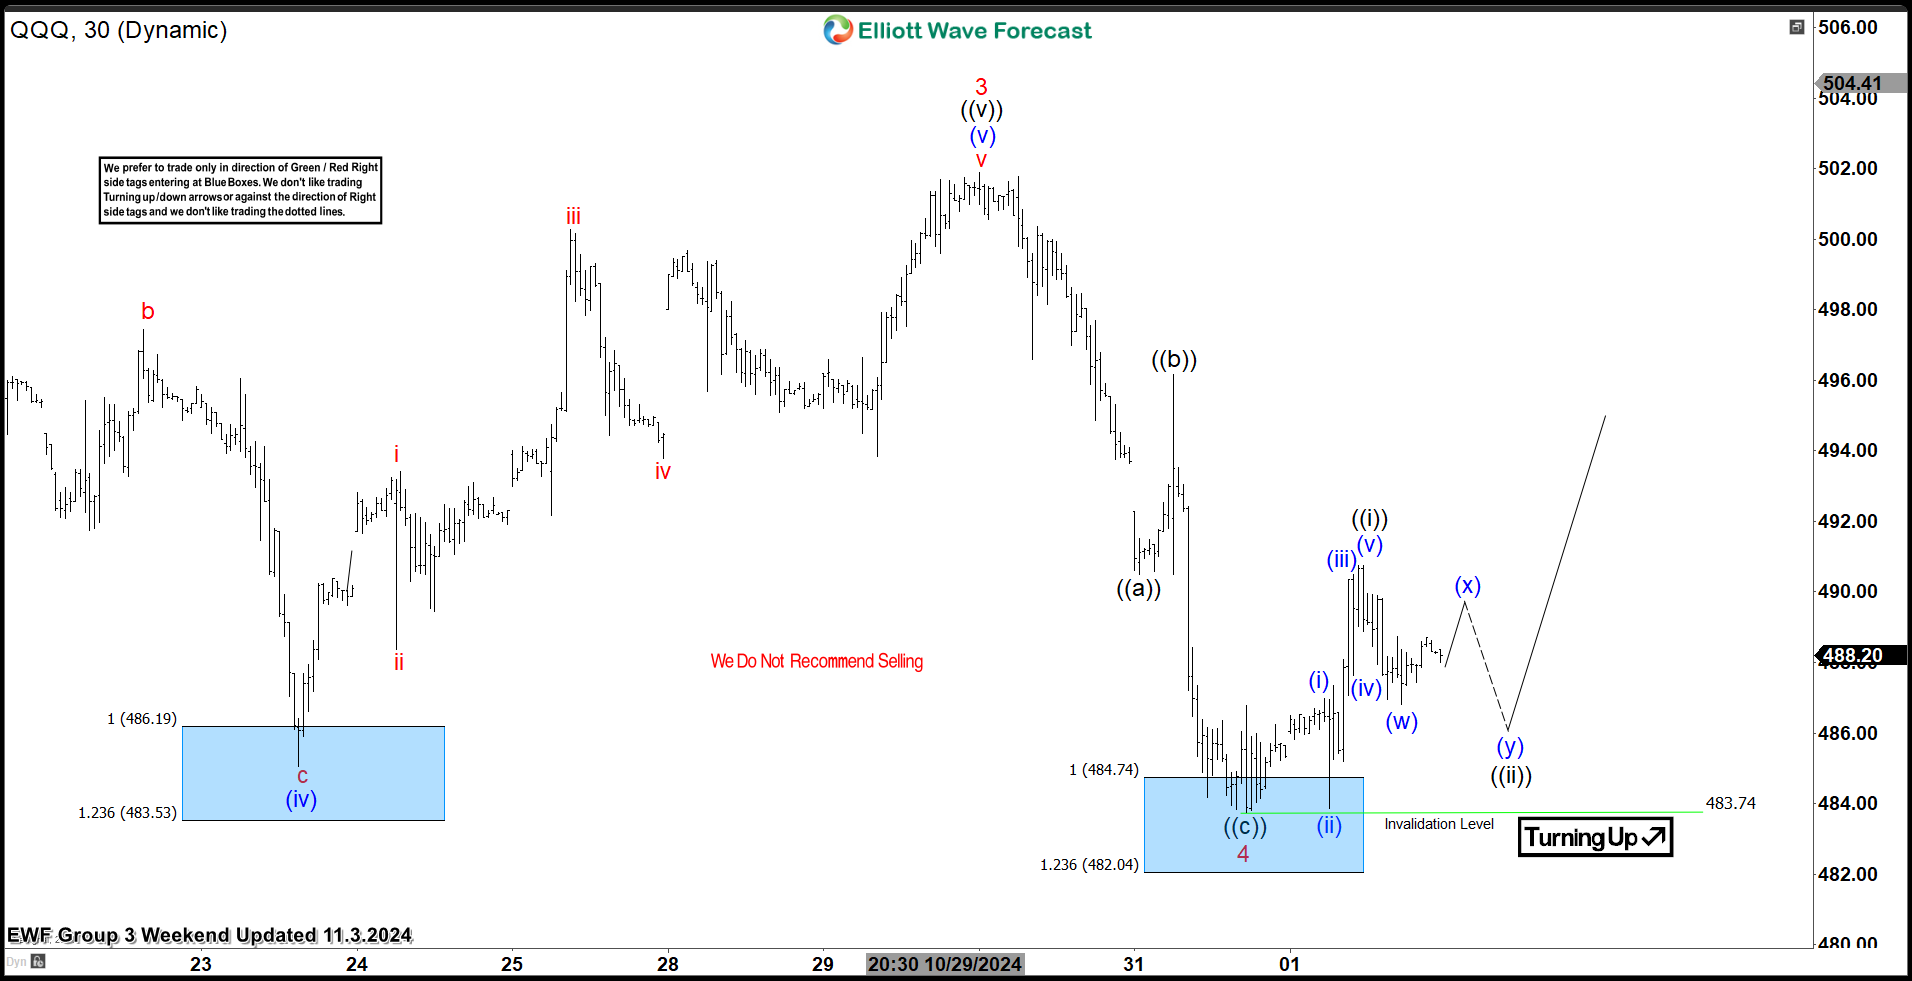
QQQ H1 Update 11.03.2024
ETF responded exactly as anticipated at the Blue Box Area. We got another marginal low and buyers appeared. QQQ made decent bounce from the buyers zone - Blue Box area. Bounce has reached 50 fibs against the connector's peak ((b)) high, so any longs from there should be already risk free.
Keep in mind not every chart is trading recommendation. For the latest updates, refer to the most recent charts available in our membership area. We focus on trading instruments with incomplete bullish or bearish swing sequences. The Live Trading Room highlights the best opportunities in real-time.
면책 조항: 본 게시글에 표현된 견해는 전적으로 작성자의 견해이며 Followme의 공식 입장을 대변하지 않습니다. Followme는 제공된 정보의 정확성, 완전성 또는 신뢰성에 대해 책임을 지지 않으며, 서면으로 명시적으로 언급되지 않는 한 해당 내용을 기반으로 취해진 어떠한 조치에 대해서도 책임을 지지 않습니다.

더 오래된 의견은 없습니다. 소파를 가장 먼저 잡으십시오.