



| Scenario | |
|---|---|
| Timeframe | Weekly |
| Recommendation | SELL STOP |
| Entry Point | 374.95 |
| Take Profit | 359.38, 343.75 |
| Stop Loss | 386.00 |
| Key Levels | 343.75, 359.38, 375.00, 390.62, 406.25, 421.88 |
| Alternative scenario | |
|---|---|
| Recommendation | BUY STOP |
| Entry Point | 390.65 |
| Take Profit | 406.25, 421.88 |
| Stop Loss | 379.00 |
| Key Levels | 343.75, 359.38, 375.00, 390.62, 406.25, 421.88 |
Current trend
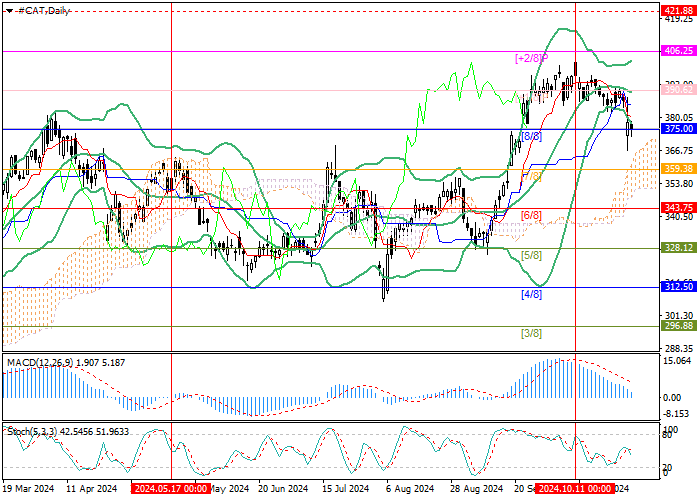
Three weeks ago, shares of Caterpillar Inc., a manufacturer of construction and mining equipment, resumed their decline: during this time, the price reached the upper limit of the Murrey trading range in the area of 375.00 (Murrey level [8/8]), which it is actively testing now. Consolidation below it will ensure the strengthening of the downward dynamics towards the targets of 359.38 (Murrey level [7/8]), 343.75 (Murrey level [6/8]) and 328.12 (Murrey level [5/8]). The key for the "bulls" is the level of 390.62 (Murrey level [ 1/8]), supported by the central line of Bollinger Bands, the breakout of which will open up the possibility for the resumption of growth of the trading instrument to 406.25 (Murrey level [ 2/8]) and 421.88 (Murrey level [ 2/8], H4), but such a scenario seems less likely.
Technical indicators confirm the likelihood of further decline: Bollinger Bands and Stochastic are reversing down, MACD is preparing to move into the negative zone and form a sell signal.
Support and resistance
Resistance levels: 390.62, 406.25, 421.88.
Support levels: 375.00, 359.38, 343.75.
Trading tips
Short positions should be opened below the 375.00 mark with targets of 359.38, 343.75 and a stop-loss around 386.00. Implementation period: 5–7 days.
Long positions can be opened above the level of 390.62 with targets of 406.25, 421.88 and a stop-loss around 379.00.
면책 조항: 본 게시글에 표현된 견해는 전적으로 작성자의 견해이며 Followme의 공식 입장을 대변하지 않습니다. Followme는 제공된 정보의 정확성, 완전성 또는 신뢰성에 대해 책임을 지지 않으며, 서면으로 명시적으로 언급되지 않는 한 해당 내용을 기반으로 취해진 어떠한 조치에 대해서도 책임을 지지 않습니다.

