
| Scenario | |
|---|---|
| Timeframe | Weekly |
| Recommendation | BUY STOP |
| Entry Point | 20600.5 |
| Take Profit | 21400.0 |
| Stop Loss | 20300.0 |
| Key Levels | 19150.0, 20100.0, 20600.0, 21400.0 |
| Alternative scenario | |
|---|---|
| Recommendation | SELL STOP |
| Entry Point | 20099.5 |
| Take Profit | 19150.0 |
| Stop Loss | 20400.0 |
| Key Levels | 19150.0, 20100.0, 20600.0, 21400.0 |
Current trend
The NQ 100 index is holding at around 20254.0 amid the publication of corporate reports.
Among the companies that presented financial results yesterday, one can highlight the technology corporation Microsoft Corp., which showed revenue of 65.6 billion dollars, which exceeded 64.55 billion dollars expected by analysts. Earnings per share (EPS) amounted to 3.3 dollars, the highest figure in the history of statistical observations of the company. In turn, the social media conglomerate Meta Platforms Inc. demonstrated revenue growth to 40.59 billion dollars from 39.07 billion dollars in the previous quarter, while EPS were fixed at 6.03 dollars against expectations of 5.21 dollars. However, the engineering company Caterpillar Inc. reported a modest 16.1 billion dollars in revenue, below both the forecast of 16.37 billion dollars and 16.8 billion dollars over the same period a year earlier. EPS fell to 5.17 dollars compared to the 5.35 dollars estimate.
The bond market is growing: the rate on 10-year debt securities rose to 4.281% from 4.213%, on 20-year ones — to 4.597% from 4.569%, and on 30-year ones — to 4.478% from 4.469%.
The leaders of growth in the index are Verisk Analytics Inc. ( 4.54%), MongoDB ( 3.08%), Alphabet Inc. Class C ( 2.92%), Warner Bros Discovery Inc. ( 2.91%).
Among the leaders of decline are Super Micro Computer Inc. (˗32.68%), CDW Corp. (˗11.30%), AMD Inc. (˗10.62%).
Support and resistance
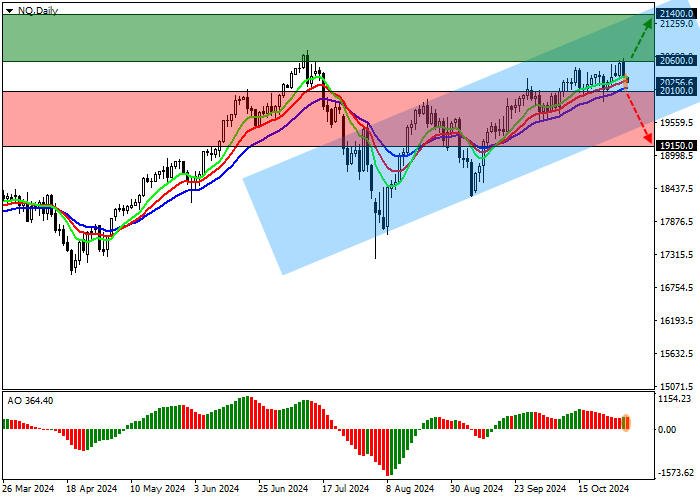
On the D1 chart, the index quotes continue to correct, remaining within the local channel with boundaries of 21500.0–19700.0.
Technical indicators have reversed around and are holding the signal to continue buying: fast EMAs on the Alligator indicator are moving away from the signal line, and the AO histogram is forming new correction bars, remaining in the purchases zone.
Support levels: 20100.0, 19150.0.
Resistance levels: 20600.0, 21400.0.
Trading tips
In case of continued growth and consolidation of the price above the level of 20600.0 one can open buy positions with a target of 21400.0. Stop loss — 20300.0. Implementation period: 7 days or more.
In case of a reversal and continuation of the corrective decline, as well as consolidation of the price below the support level of 20100.0, sell positions with a target of 19150.0 will be relevant. Stop loss — 20400.0.
면책 조항: 본 게시글에 표현된 견해는 전적으로 작성자의 견해이며 Followme의 공식 입장을 대변하지 않습니다. Followme는 제공된 정보의 정확성, 완전성 또는 신뢰성에 대해 책임을 지지 않으며, 서면으로 명시적으로 언급되지 않는 한 해당 내용을 기반으로 취해진 어떠한 조치에 대해서도 책임을 지지 않습니다.
더 오래된 의견은 없습니다. 소파를 가장 먼저 잡으십시오.