| Scenario | |
|---|---|
| Timeframe | Intraday |
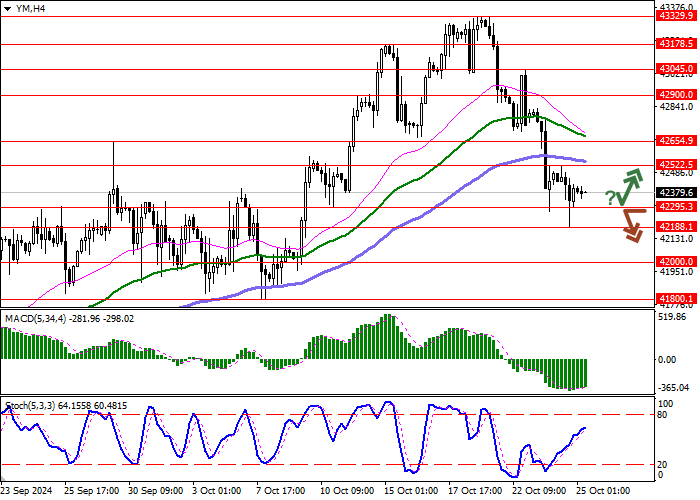
| Recommendation | SELL STOP |
| Entry Point | 42295.0 |
| Take Profit | 42000.0 |
| Stop Loss | 42400.0 |
| Key Levels | 41800.1, 42000.0, 42188.1, 42295.3, 42522.5, 42654.9, 42900.0, 43045.0 |
| Alternative scenario | |
|---|---|
| Recommendation | BUY STOP |
| Entry Point | 42523.0 |
| Take Profit | 42800.0 |
| Stop Loss | 42380.0 |
| Key Levels | 41800.1, 42000.0, 42188.1, 42295.3, 42522.5, 42654.9, 42900.0, 43045.0 |
Current trend
During the morning session, the leading US index, the Dow Jones Industrial Average is slightly down after renewing the low of October 9, trading at 42370.0.
Poor corporate reporting, as well as the upcoming US presidential elections, which are increasing political uncertainty, are putting pressure on the asset. At the same time, the American dollar is strengthening amid the increasing likelihood of victory for Republican candidate Donald Trump. He may have more “hawkish” monetary rhetoric and tighten tariff policy on foreign trade with China and the EU. However, markets are still counting on the US Fed adjusting the interest rate by –25 basis points in November. Forecasts for the December meeting are less clear, but the probability of a similar change in the indicator is high.
Meanwhile, traders are assessing the October business activity data. The S&P Global manufacturing PMI strengthened from 47.3 points to 47.8 points, above the forecast of 47.5 points, and the service PMI – from 55.2 points to 55.3 points, contrary to estimates of a slowdown to 55.0 points. Today at 14:30 (GMT 2), September statistics on durable goods orders are due. According to preliminary estimates, the indicator will decrease from 0.0% to –1.1%, and excluding transport – from 0.5% to –0.1%. Five-year inflation expectations of consumers from the University of Michigan in October may remain at 3.0%, and the consumer confidence index may increase from 68.9 points to 69.0 points.
Support and resistance
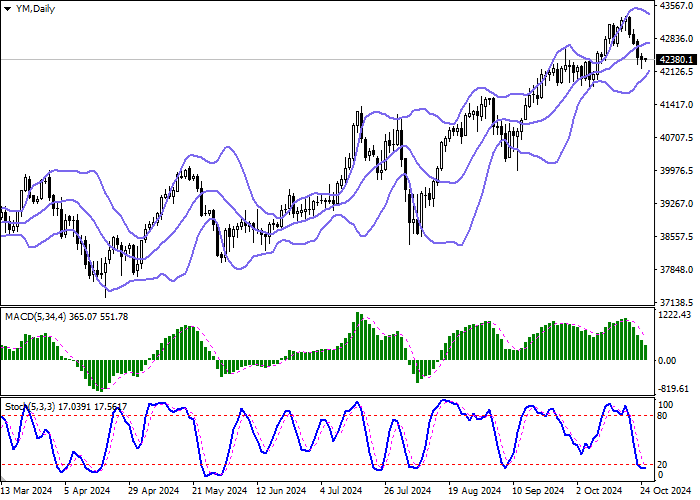
On the daily chart, Bollinger bands are moving horizontally. The price range is narrowing, reflecting the emergence of ambiguous trading dynamics in the short term. The MACD indicator is declining, maintaining a strong sell signal (the histogram is below the signal line). Stochastic, having dropped below “20”, reversed sideways, indicating the possibility of corrective growth in the ultra-short term.
Resistance levels: 42522.5, 42654.9, 42900.0, 43045.0.
Support levels: 42295.3, 42188.1, 42000.0, 41800.1.

Trading tips
Short positions may be opened after a breakdown of 42295.3, with the target at 42000.0. Stop loss – 42400.0. Implementation period: 2–3 days.
Long positions may be opened after a rebound from 42295.3 and a breakout of 42522.5, with the target at 42800.0. Stop loss – 42380.0.
면책 조항: 본 게시글에 표현된 견해는 전적으로 작성자의 견해이며 Followme의 공식 입장을 대변하지 않습니다. Followme는 제공된 정보의 정확성, 완전성 또는 신뢰성에 대해 책임을 지지 않으며, 서면으로 명시적으로 언급되지 않는 한 해당 내용을 기반으로 취해진 어떠한 조치에 대해서도 책임을 지지 않습니다.

더 오래된 의견은 없습니다. 소파를 가장 먼저 잡으십시오.