General Electric (GE) is a high-tech industrial company founded in 1892 through the merger of Thomas Edison's Edison General Electric Company and Thomson-Houston Electric Company. GE operates through several key segments, including aerospace, renewable energy, and power. The company designs and produces commercial and military aircraft engines, renewable energy generation equipment, and various power generation systems. In this article and video, we will look at the Elliott Wave technical outlook for the company which will soon present an opportunity to buy the dips.
General Electric (GE) Monthly Elliott Wave Chart
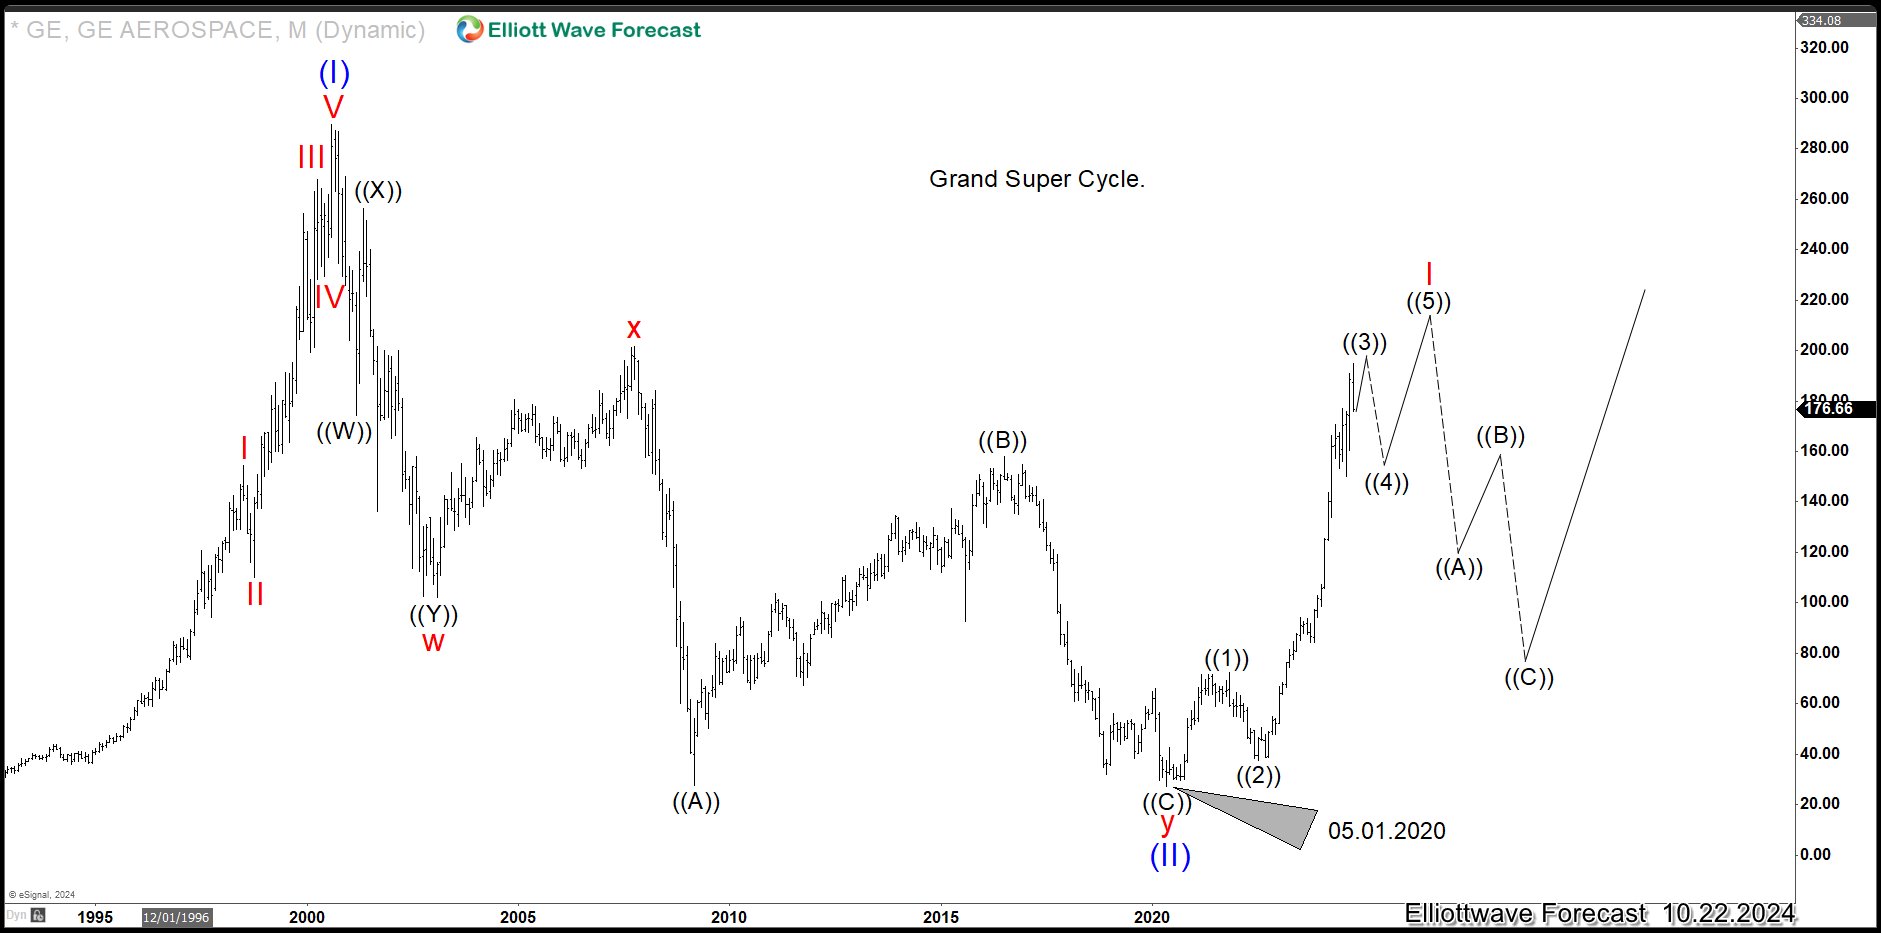
Monthly Elliott Wave View in General Electric (GE) above shows a very nice 7 swing structure pullback. The correction ended at 27.28 on 5.1.2020 low as wave (II). The stock then rallies higher from there in wave (III). Internal subdivision of the rally unfolds as a 5 waves impulse Elliott Wave structure. Up from wave (II), wave ((1)) ended at 72.29 and pullback in wave ((2)) ended at 37.30. The stock has extended higher in wave ((3)) with clear separation (extension). Expect wave ((3)) to end soon and the stock to pullback in wave ((4)) which should give a buying opportunity in 3, 7, or 11 swing.
General Electric Weekly Elliott Wave Chart
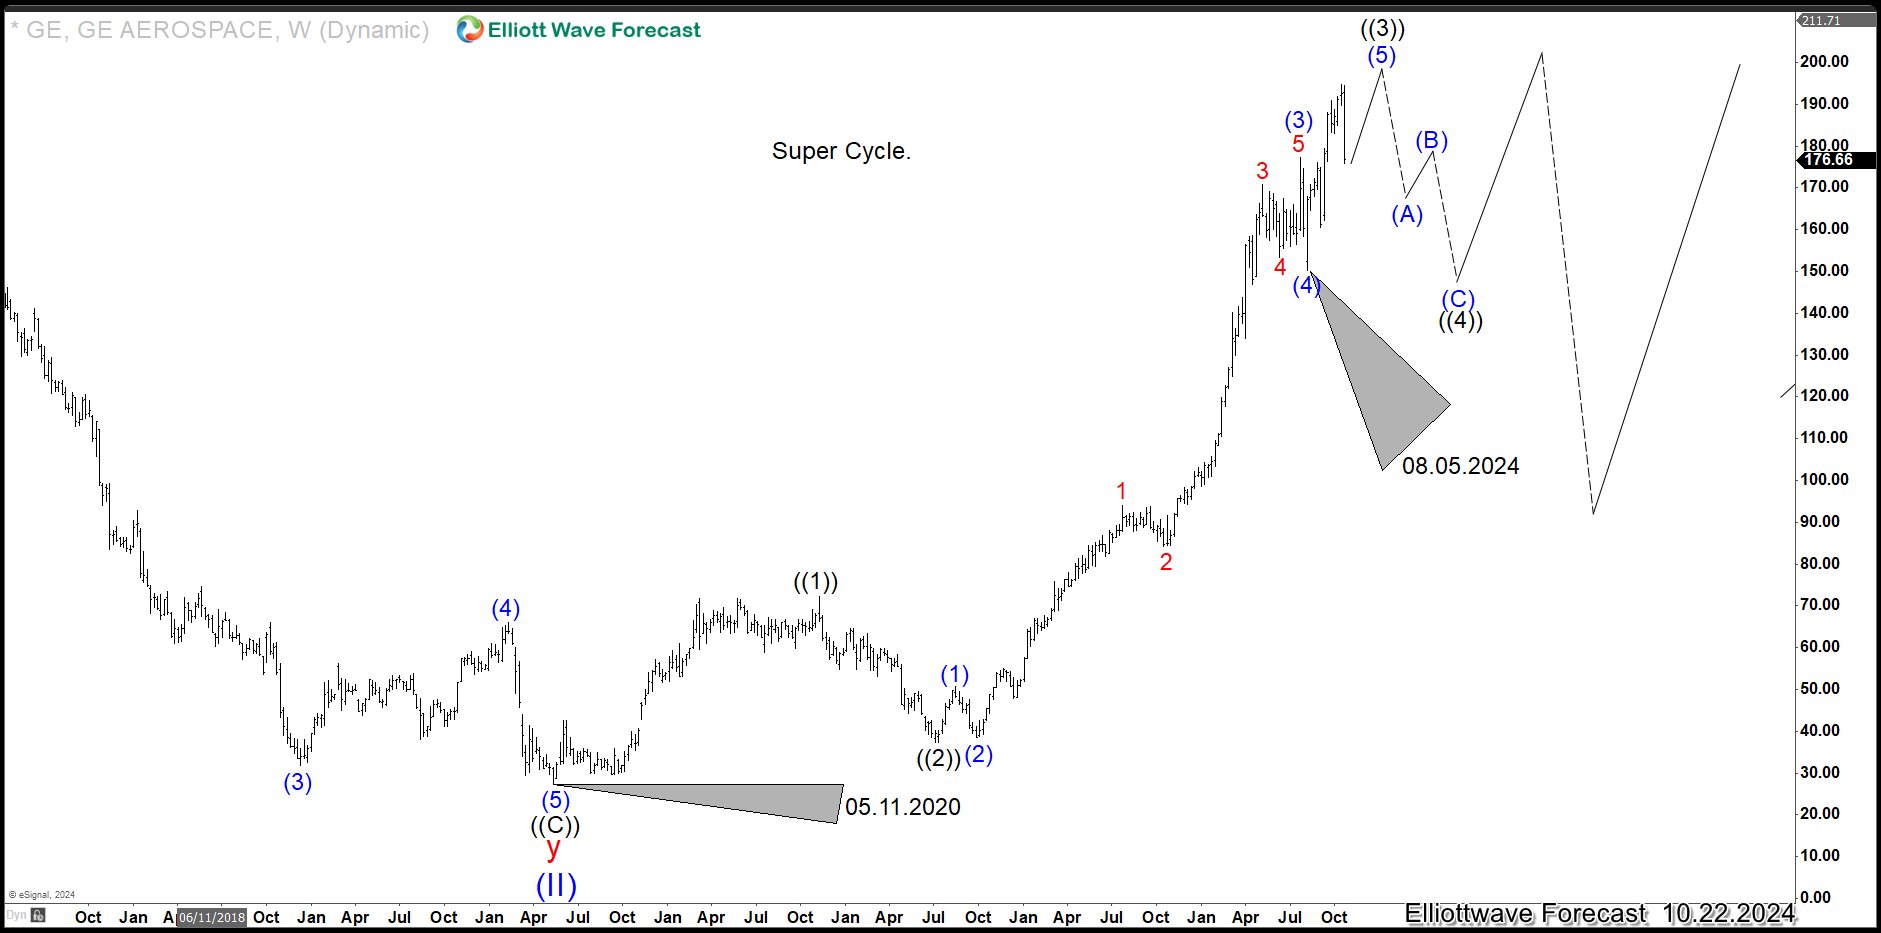
Weekly Elliott Wave View on General Electric (GE) above shows that the rally from 5.11.2020 low is in progress as an impulse. Up from there, wave ((1)) ended at 72.29 and wave ((2)) pullback ended at 37.30. The stock has either ended wave ((3)) or expected to end wave ((3)) soon. Either way, a pullback in wave ((4)) is near. The pullback should unfold in 3, 7, or 11 swing before the next leg higher.
General Electric 4 Hour Elliott Wave Chart
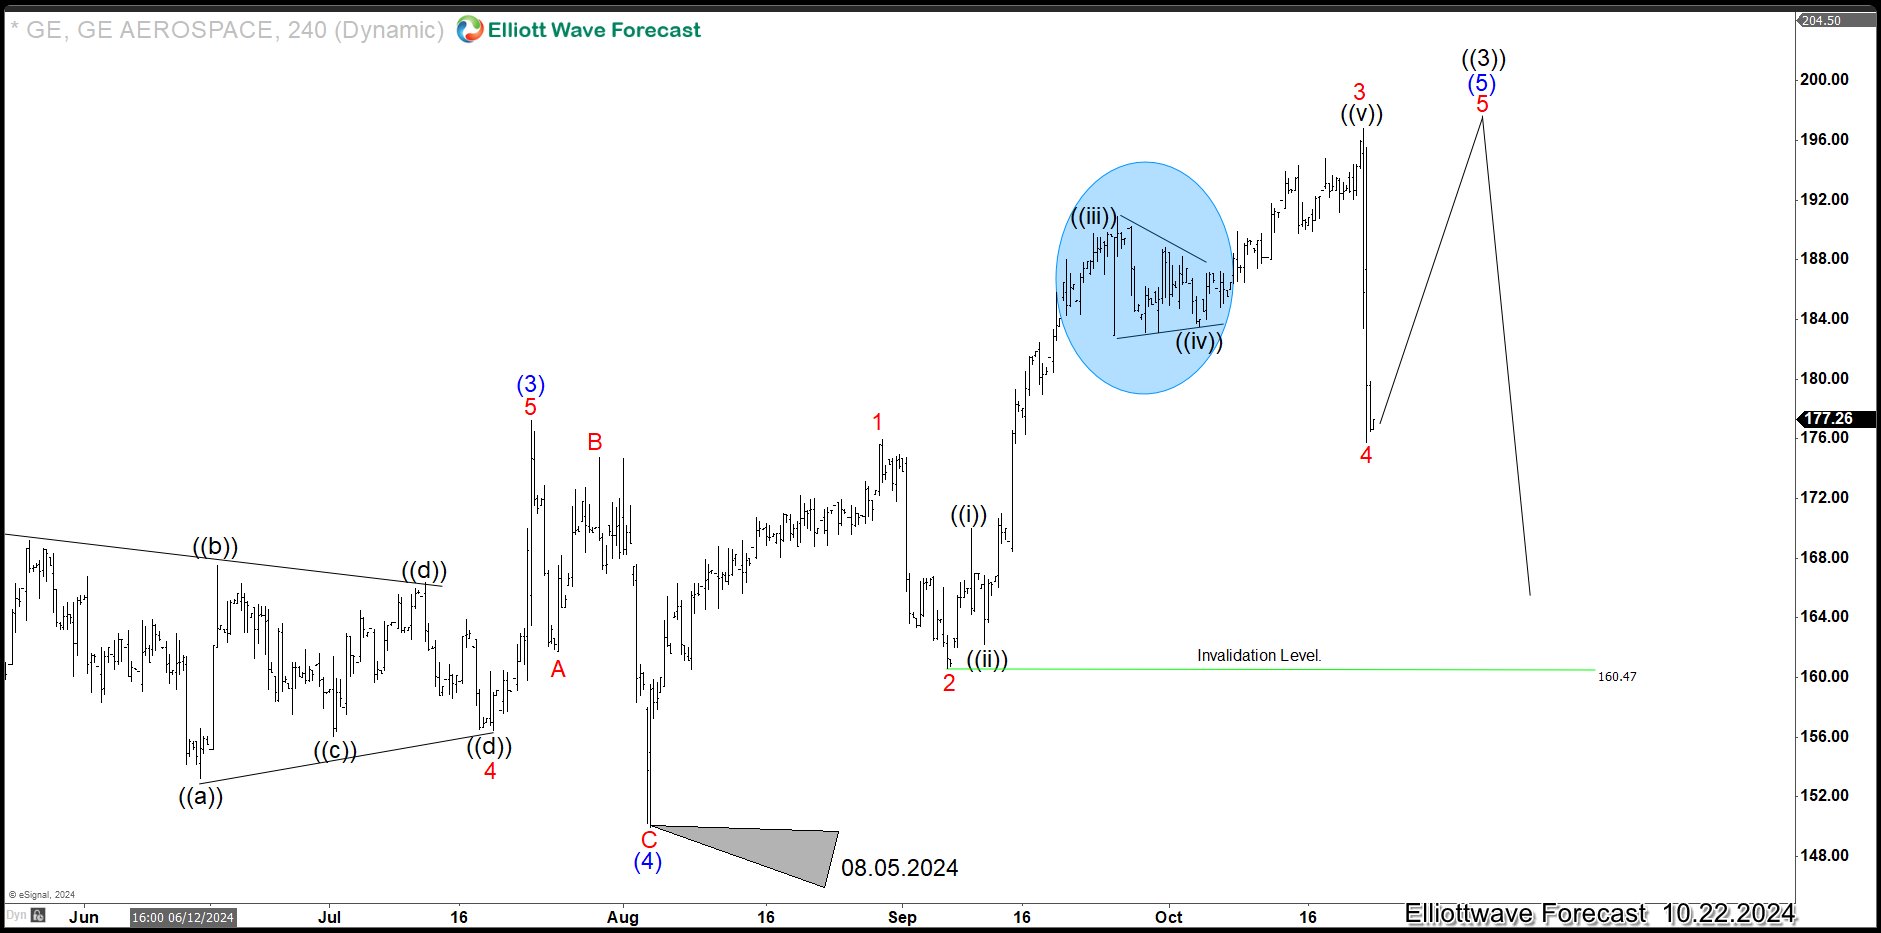
4 Hour Chart of General Electric (GE) above shows that the stock is close to ending wave 5 of (5) of ((3)). It either rallies 1 more leg to complete wave ((3)) or wave ((3)) has already ended at the last peak (196.77). Expect pullback in wave ((4)) to happen anytime to correct cycle from July 4, 2022 low. Pullback should unfold in 3, 7, or 11 swing before the next leg higher.
면책 조항: 본 게시글에 표현된 견해는 전적으로 작성자의 견해이며 Followme의 공식 입장을 대변하지 않습니다. Followme는 제공된 정보의 정확성, 완전성 또는 신뢰성에 대해 책임을 지지 않으며, 서면으로 명시적으로 언급되지 않는 한 해당 내용을 기반으로 취해진 어떠한 조치에 대해서도 책임을 지지 않습니다.

더 오래된 의견은 없습니다. 소파를 가장 먼저 잡으십시오.