
| Scenario | |
|---|---|
| Timeframe | Intraday |
| Recommendation | BUY STOP |
| Entry Point | 1.3805 |
| Take Profit | 1.3900 |
| Stop Loss | 1.3750 |
| Key Levels | 1.3675, 1.3700, 1.3730, 1.3765, 1.3800, 1.3838, 1.3864, 1.3900 |
| Alternative scenario | |
|---|---|
| Recommendation | SELL STOP |
| Entry Point | 1.3760 |
| Take Profit | 1.3700 |
| Stop Loss | 1.3800 |
| Key Levels | 1.3675, 1.3700, 1.3730, 1.3765, 1.3800, 1.3838, 1.3864, 1.3900 |
Current trend
The USD/CAD pair is showing mixed dynamics, consolidating near 1.3800 and local highs from October 15: market activity at the end of the week remains quite low due to the small number of macroeconomic publications. Investors continue to evaluate the data presented earlier and are preparing for the upcoming US presidential elections in early November.
Yesterday, the US market received data on Retail Sales: in September, the indicator increased by 0.4% after increasing by 0.1% in the previous month, while analysts expected 0.3%. Meanwhile, Industrial Production lost 0.3% after growing by 0.3% in the previous month, while analysts expected –0.2%. In addition, the Philadelphia Fed Manufacturing Survey rose from 1.7 points to 10.3 points in October, the Initial Jobless Claims for the week ended October 11 sharply decreased from 260.0 thousand to 241.0 thousand, and the Continuing Jobless Claims for the week ended October 4 increased from 1.858 million to 1.867 million, but turned out to be lower than the expected 1.870 million.
On Tuesday, Canada released inflation data that could influence future monetary policy decisions: the Bank of Canada's Consumer Price Index Core in September showed zero monthly dynamics after –0.1% in the previous month, and in annual terms it adjusted from 1.5% to 1.6%, while the Consumer Price Index fell from –0.2% to –0.4% and from 2.0% to 1.6%, against preliminary estimates of 1.8%, respectively.
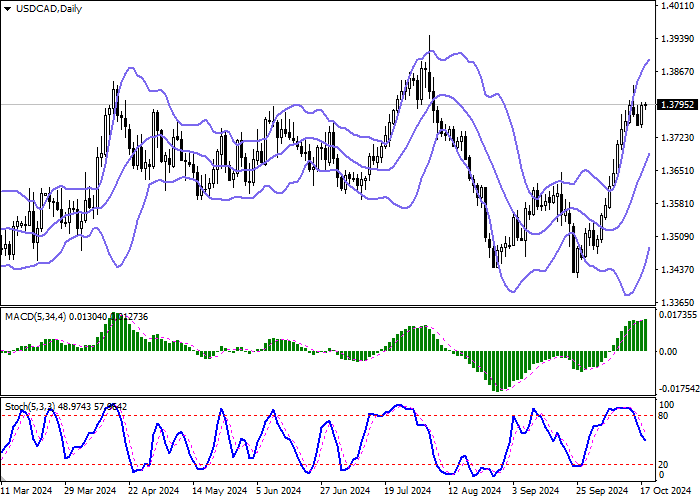
Support and resistance
Bollinger Bands on the daily chart demonstrate confident growth: the price range narrows slightly from below, but remains quite spacious for the current level of activity on the market. MACD is growing, maintaining a weak buy signal (the histogram is located above the signal line). Stochastic, on the contrary, maintains a confident downward direction, practically not reacting to the appearance of corrective growth at the end of the week.
Resistance levels: 1.3800, 1.3838, 1.3864, 1.3900.
Support levels: 1.3765, 1.3730, 1.3700, 1.3675.
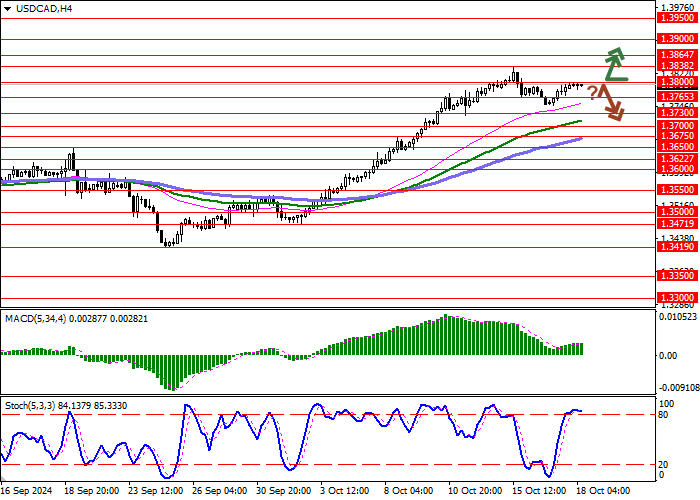
Trading tips
Long positions can be opened after a confident breakout of 1.3800 with a target of 1.3900. Stop-loss — 1.3750. Implementation time: 2-3 days.
A rebound from 1.3800 as resistance followed by a breakdown of 1.3765 may be a signal to open new short positions with a target of 1.3700. Stop-loss — 1.3800.
면책 조항: 본 게시글에 표현된 견해는 전적으로 작성자의 견해이며 Followme의 공식 입장을 대변하지 않습니다. Followme는 제공된 정보의 정확성, 완전성 또는 신뢰성에 대해 책임을 지지 않으며, 서면으로 명시적으로 언급되지 않는 한 해당 내용을 기반으로 취해진 어떠한 조치에 대해서도 책임을 지지 않습니다.

더 오래된 의견은 없습니다. 소파를 가장 먼저 잡으십시오.