| Scenario | |
|---|---|
| Timeframe | Weekly |
| Recommendation | SELL STOP |
| Entry Point | 69.05 |
| Take Profit | 65.10 |
| Stop Loss | 71.00 |
| Key Levels | 65.10, 69.10, 71.30, 75.40 |
| Alternative scenario | |
|---|---|
| Recommendation | BUY STOP |
| Entry Point | 71.35 |
| Take Profit | 75.40 |
| Stop Loss | 70.00 |
| Key Levels | 65.10, 69.10, 71.30, 75.40 |
Current trend
WTI Crude Oil prices continue their downward trend, once again approaching the key level of 70.00 this week.
"Black gold" continues to react to the worsening geopolitical situation in the Middle East, which creates unpredictability in price fluctuations. According to CNN, after more than a week of silence, Israeli authorities have announced their readiness to launch a retaliatory strike against Iran, which could take place before the US presidential elections. Despite this, experts doubt that the escalation will occur before November 5, as official Washington has called on Israel to refrain from aggressive actions in the near future. Traders are closely monitoring the situation, as oil facilities in Iran have previously been named as key targets of the IDF.
In addition, investors focus on crude inventory reports from the American Petroleum Institute (API) and the US Energy Information Administration (EIA). API reported a drawdown of 1.580 million barrels of crude oil in storage yesterday, following a significant increase of 10.900 million barrels the week before. Today, the EIA releases data that is expected to show an increase in inventories of 1.800 million barrel, following a 5.810 million barrel gain that broke an 11-week cycle of declines.
In turn, the Chicago Mercantile Exchange (CME Group) reported yesterday's drop in the daily trading volume of WTI Crude Oil contracts to 870.0 thousand from 1.7 million contracts at the beginning of the month. Investors are wary of strong fluctuations, preferring to remain without positions until the situation becomes clearer.
Support and resistance
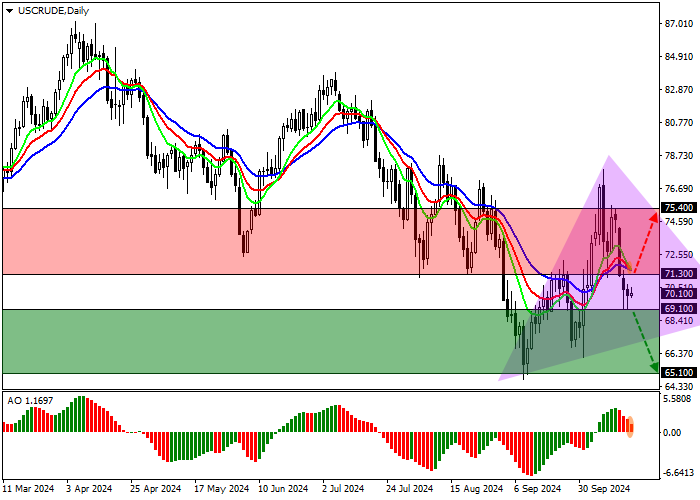
On the daily chart, the price is falling within the next wave within the Expanding Formation pattern with boundaries of 75.50–67.00.
Technical indicators weaken the buy signal: fast EMAs on the Alligator indicator are approaching the signal line, narrowing the range of fluctuations, and the AO histogram is forming new corrective bars, while falling in the buy zone.
Support levels: 69.10, 65.10.
Resistance levels: 71.30, 75.40.

Trading tips
If the decline continues and the price consolidates below the support level of 69.10, it is relevant to open sell positions with a target of 65.10. Stop-loss — 71.00. Implementation time: 7 days and more.
If the asset continues to grow, as well as the price consolidates above the resistance level of 71.30, long positions with a target of 75.40 will be relevant. Stop-loss — 70.00.
면책 조항: 본 게시글에 표현된 견해는 전적으로 작성자의 견해이며 Followme의 공식 입장을 대변하지 않습니다. Followme는 제공된 정보의 정확성, 완전성 또는 신뢰성에 대해 책임을 지지 않으며, 서면으로 명시적으로 언급되지 않는 한 해당 내용을 기반으로 취해진 어떠한 조치에 대해서도 책임을 지지 않습니다.

더 오래된 의견은 없습니다. 소파를 가장 먼저 잡으십시오.