


MicroStrategy (NASDAQ: MSTR) is one of the top performing stocks in recent two years. In our previous article, we explained the impulsive structure taking place since 2022 low. In this article, we’ll take a look at the potential targets to the upside based on the Elliott Wave Theory.
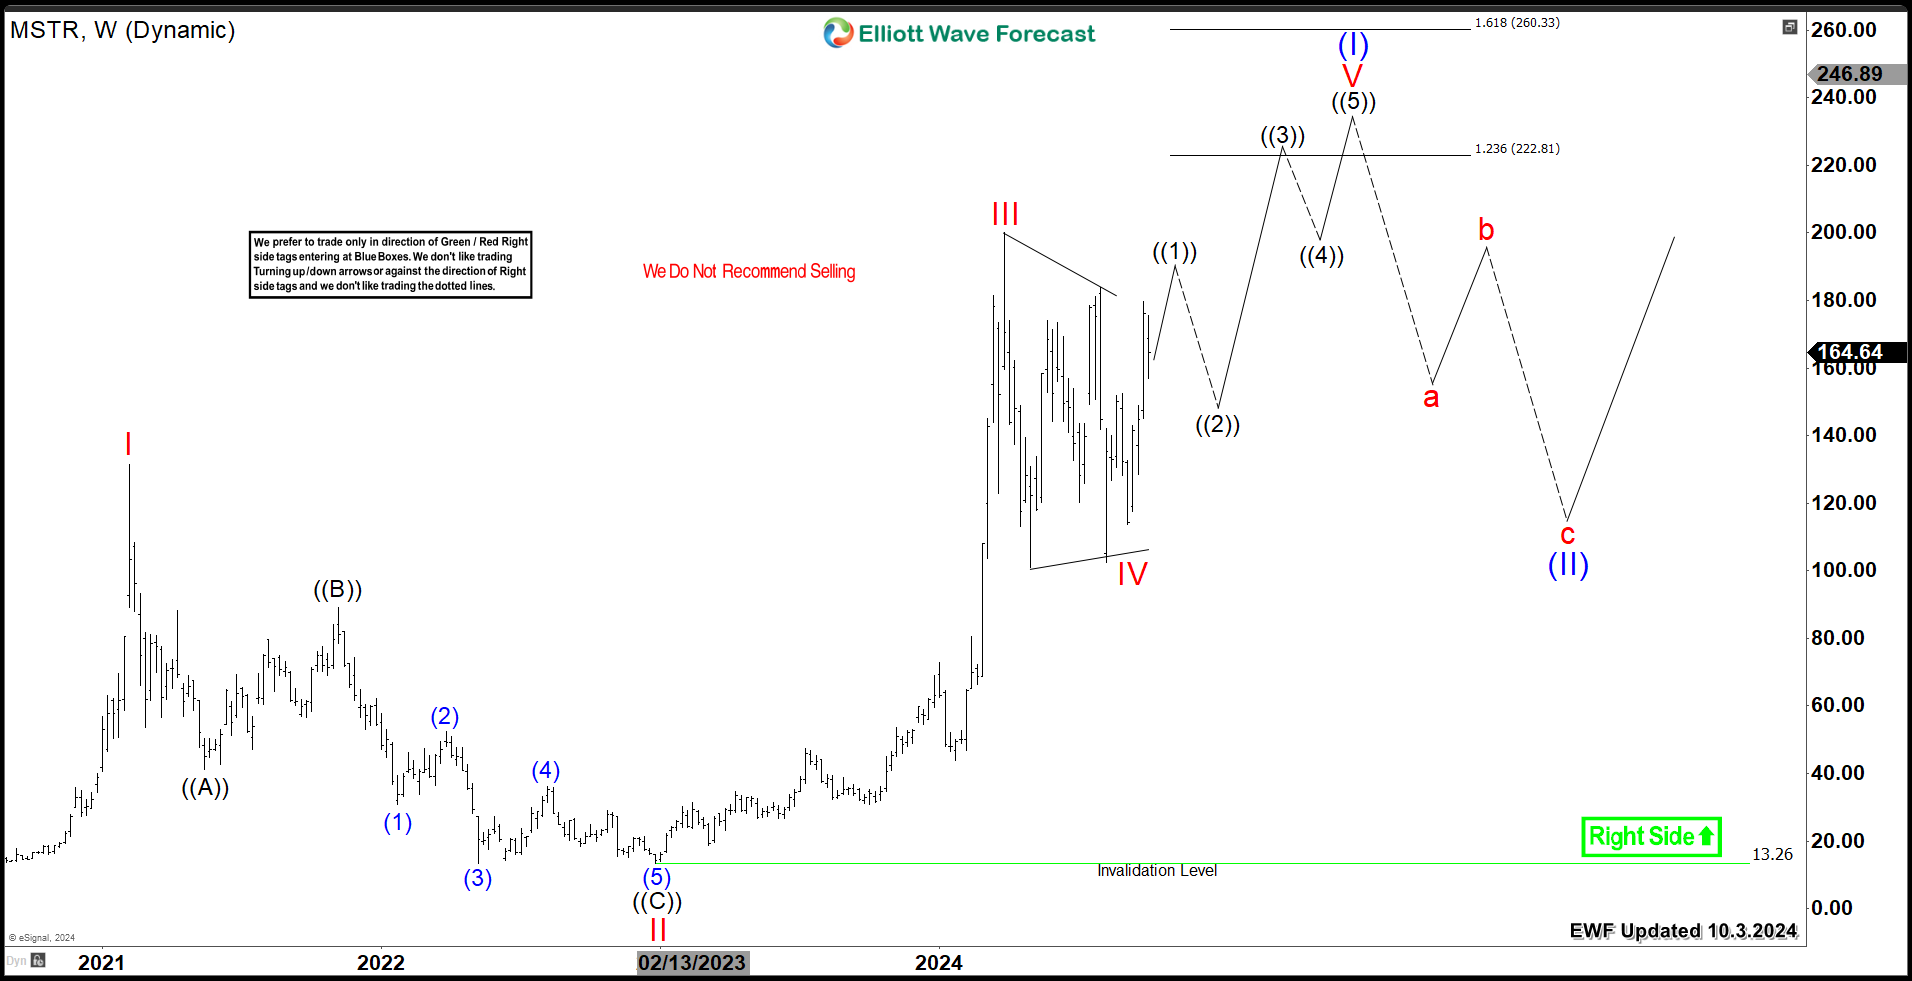
MSTR started is major bullish cycle in 2002. Since then, the stock is currently showing a 3 waves to the upside and it's still expected to finish a 5 waves advance before a major correction takes place. The recent peak in March 2024 is proposed to be a wave III which is followed by a sideways price action in a triangle wave IV. As long as the stocks holds above September 2024 low $113.69 then it's expected to continue the rally higher within a wave V.
The initial weekly target area for 5th wave comes at the inverted Fibonacci levels of wave IV and it's suggest the area of $222 - $260 to end the cycle. Alternatively, MSTR could extend further beyond that area and look for the equal legs area of the 2024 connector. In that case a higher target at $287 - $331 can be seen before the next correction takes place.
The overall technical structure for MSTR is bullish and suggesting more upside within the weekly cycle. Therefore we don't recommend selling the stock and we only suggest buying the pullbacks in 3 , 7 or 11 swings within daily cycle.
MSTR Weekly Chart 10.03.2024
면책 조항: 본 게시글에 표현된 견해는 전적으로 작성자의 견해이며 Followme의 공식 입장을 대변하지 않습니다. Followme는 제공된 정보의 정확성, 완전성 또는 신뢰성에 대해 책임을 지지 않으며, 서면으로 명시적으로 언급되지 않는 한 해당 내용을 기반으로 취해진 어떠한 조치에 대해서도 책임을 지지 않습니다.

