


at the "Hold" level and maintained a target price of 50.0 dollars
| Scenario | |
|---|---|
| Timeframe | Weekly |
| Recommendation | BUY STOP |
| Entry Point | 45.55 |
| Take Profit | 48.60 |
| Stop Loss | 44.00 |
| Key Levels | 41.20, 44.10, 45.50, 48.60 |
| Alternative scenario | |
|---|---|
| Recommendation | SELL STOP |
| Entry Point | 44.05 |
| Take Profit | 41.20 |
| Stop Loss | 46.00 |
| Key Levels | 41.20, 44.10, 45.50, 48.60 |
Current trend
Shares of Verizon Communications Inc., one of the largest American telecommunications companies, are adjusting at 45.00.
Recently, the company was faced with a serious malfunction in its high-speed Internet network, which affected thousands of customers in the United States, and the management of Verizon Communications Inc. did not comment on the causes or the time required to eliminate all the consequences. Nevertheless, yesterday it became known about the signing of a new deal with the mobile tower operator Vertical Bridge in the amount of 3.3 billion dollars, which will allow the facilities to be used for 10 years, followed by the possibility of extending the contract for another 50 years. This will help to significantly reduce the cost of installing own network, as well as preserve backup channels for providing services in case of emergencies.
HSBC bank experts confirmed the rating of the emitter's shares at the "Hold" level, maintaining a target price of 50.0 dollars per paper with a short-term growth potential of 4.7%, which became possible against the background of reports about a possible merger of Verizon Communications Inc. with Frontier Communications Parent Inc., which may require 21.5 billion dollars in expenses. Analysts believe that the deal will significantly limit the process of reducing the company's debt, making its shares less attractive to investors.
Support and resistance
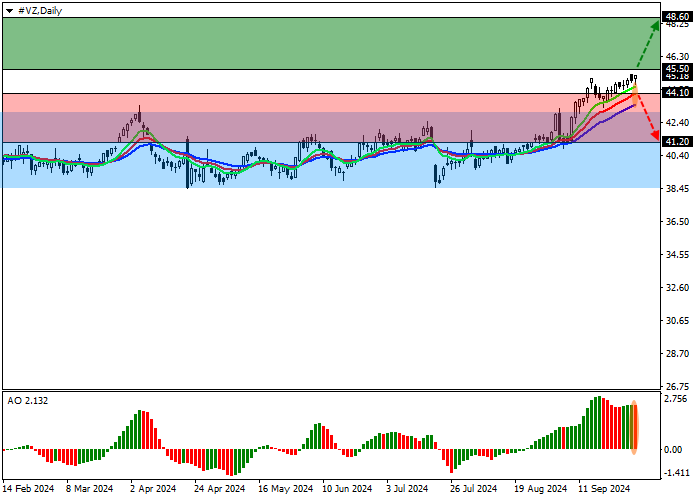
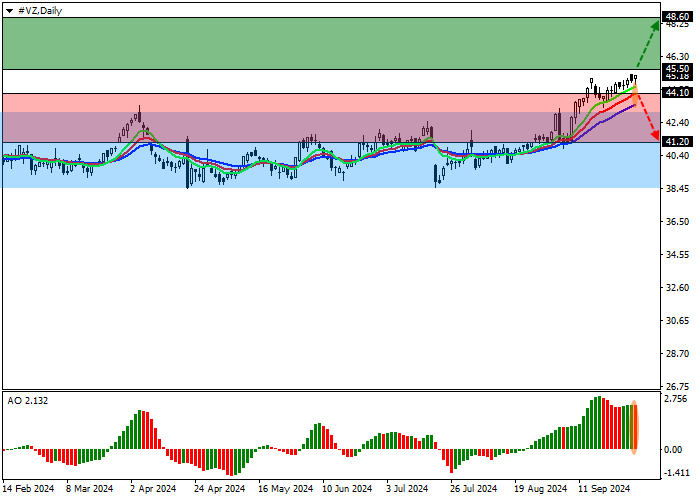
On the D1 chart, the asset is adjusted and held above the resistance line of the lateral channel with the boundaries of 43.00–38.50.
Technical indicators are in a state of stable buy signal: the range of EMAs fluctuations on the Alligator indicator is expanding, and the AO histogram forms bars with a tendency to increase, holding above the transition level.
Support levels: 44.10, 41.20.
Resistance levels: 45.50, 48.60.
Trading tips
In the event of a reversal and continued corrective growth of the asset, as well as price consolidation above the resistance level of 45.50, one may open long positions with a target of 48.60 and a stop-loss of 44.00. Implementation period: 7 days and more.
In the event of a reversal and continued decline of the asset, as well as price consolidation below the support level of 44.10, one can open short positions with a target of 41.20 and a stop-loss of 46.00.
면책 조항: 본 게시글에 표현된 견해는 전적으로 작성자의 견해이며 Followme의 공식 입장을 대변하지 않습니다. Followme는 제공된 정보의 정확성, 완전성 또는 신뢰성에 대해 책임을 지지 않으며, 서면으로 명시적으로 언급되지 않는 한 해당 내용을 기반으로 취해진 어떠한 조치에 대해서도 책임을 지지 않습니다.

