



| Scenario | |
|---|---|
| Timeframe | Weekly |
| Recommendation | SELL STOP |
| Entry Point | 0.8420 |
| Take Profit | 0.8300, 0.8178 |
| Stop Loss | 0.8520 |
| Key Levels | 0.8178, 0.8300, 0.8422, 0.8544, 0.8789, 0.8911 |
| Alternative scenario | |
|---|---|
| Recommendation | BUY STOP |
| Entry Point | 0.8545 |
| Take Profit | 0.8789, 0.8911 |
| Stop Loss | 0.8450 |
| Key Levels | 0.8178, 0.8300, 0.8422, 0.8544, 0.8789, 0.8911 |
Current trend
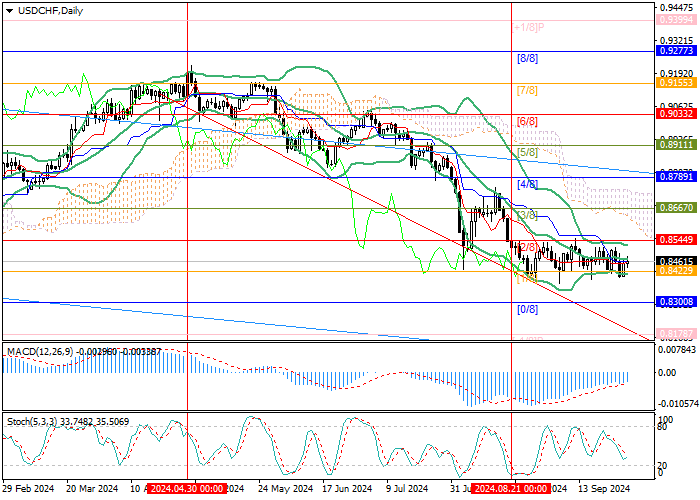
The USD/CHF pair has been trading in a sideways range of 0.8544–0.8422 (Murrey level [2/8]–[1/8]) for the seventh week in a row: yesterday, the price reversed around its lower border and rose to the central line of Bollinger Bands around 0.8470.
The US dollar received support after the statement of the US Federal Reserve Chairman Jerome Powell about the gradual easing of monetary parameters. Speaking yesterday at the annual meeting of the National Association for Business Economics (NABE), the official noted that the regulator would most likely continue to reduce the cost of borrowing by 25 basis points, although most experts expected an adjustment of ˗50 basis points at the next meeting.
However, the potential for the USD/CHF pair to exit the sideways channel currently seems limited, as the actions of the US Federal Reserve and the Swiss National Bank soon are likely to be similar. Despite Jerome Powell's latest statements, investors are looking at two more rate cuts before the end of the year, in November and December, not ruling out more serious changes in the parameter if unemployment in the US continues to accelerate. Swiss colleagues have already adjusted the key rate three times this year, bringing it to 1.00%, and the SNB Chairman Thomas Jordan said yesterday that the “dovish” course will be continued, as inflation has been held in the target range of 0.0–2.0% for 15 months already.
Support and resistance
Technically, the price remains in the range of 0.8544–0.8422 (Murrey level [2/8]–[1/8]), consolidation below which will ensure strengthening of the downward dynamics to the targets of 0.8300 (Murrey level [0/8]) and 0.8178 (Murrey level [˗1/8]). If the 0.8544 mark is broken out, growth may resume to the levels of 0.8789 (Murrey level [4/8]), 0.8911 (Murrey level [5/8]).
Technical indicators do not give a clear signal: Bollinger Bands are horizontal, MACD is stable in the negative zone, and Stochastic is directed downwards.
Resistance levels: 0.8544, 0.8789, 0.8911.
Support levels: 0.8422, 0.8300, 0.8178.
Trading tips
Short positions should be opened below 0.8422 with targets at 0.8300, 0.8178 and stop-loss at 0.8520. Implementation period: 5–7 days.
Long positions can be opened above the 0.8544 mark with targets at 0.8789, 0.8911 and stop-loss at 0.8450.
면책 조항: 본 게시글에 표현된 견해는 전적으로 작성자의 견해이며 Followme의 공식 입장을 대변하지 않습니다. Followme는 제공된 정보의 정확성, 완전성 또는 신뢰성에 대해 책임을 지지 않으며, 서면으로 명시적으로 언급되지 않는 한 해당 내용을 기반으로 취해진 어떠한 조치에 대해서도 책임을 지지 않습니다.

