



| Scenario | |
|---|---|
| Timeframe | Weekly |
| Recommendation | SELL STOP |
| Entry Point | 0.8370 |
| Take Profit | 0.8230 |
| Stop Loss | 0.8430 |
| Key Levels | 0.8230, 0.8370, 0.8440, 0.8570 |
| Alternative scenario | |
|---|---|
| Recommendation | BUY STOP |
| Entry Point | 0.8440 |
| Take Profit | 0.8570 |
| Stop Loss | 0.8400 |
| Key Levels | 0.8230, 0.8370, 0.8440, 0.8570 |
Current trend
The USD/CHF pair is trading in a correction trend at 0.8410. The franc’s positions remain stable, and at the end of last week, the Swiss National Bank took another step in favor of maintaining this trend, cutting the interest rate by 25 basis points to 1.00% against a significant weakening of inflation, which fell to 1.1% by the end of August from 1.4% earlier. The regulator’s officials noted the progress achieved in reducing consumer prices and reported that it is mainly due to changes in the cost of domestic services. The department’s forecasts for the indicator’s dynamics for 2024 remain at 1.2%, in 2025, it may slow down to 0.6%, and in 2026, to 0.7% if the cost of borrowing remains at 1.00%. For now, the monetary authorities hint that no new monetary policy easing is planned soon. As for the economy, it may grow in 2024 to 1.0% and by 1.5% in 2025, which is fully consistent with the previously announced goals.
Against this background, the position of the American dollar does not look stable, especially since its quotes have fallen to the year’s low of 100.20 in USDX again. Investors are still trying to guess how the interest rate adjustment will affect economic growth, and concerns about a new acceleration of inflation are still prevalent. Thus, the indicator of the core price index for personal consumption in August changed from 0.2% to 0.1%, which led to an increase in the year’s indicator to 2.7% from 2.6%, which is calculated excluding fuel and food prices and is an analogue of consumer inflation: its positive dynamics puts pressure on the asset.
Support and resistance
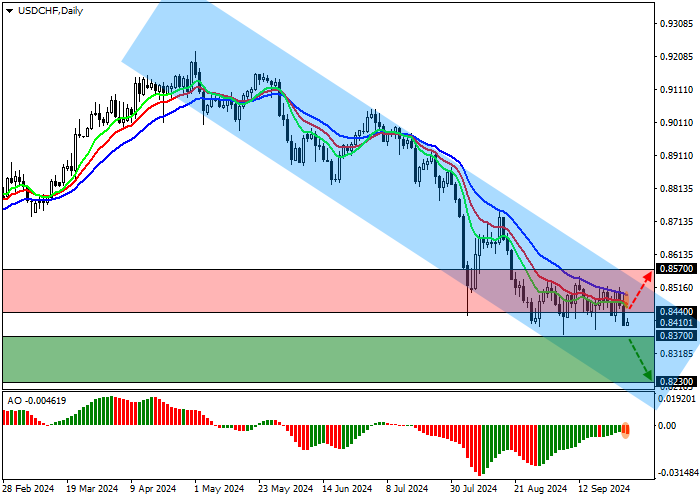
On the daily chart, the trading instrument is correcting above the year’s low of 0.8380.
Technical indicators strengthen the sell signal: fast EMAs on the Alligator indicator are below the signal line, and the AO histogram forms correction bars in the sell zone.
Resistance levels: 0.8440, 0.8570.
Support levels: 0.8370, 0.8230.
Trading tips
Short positions may be opened after the price declines and consolidates below 0.8370, with the target at 0.8230. Stop loss — 0.8430. Implementation period: 7 days or more.
Long positions may be opened after the price grows and consolidates above 0.8440, with the target at 0.8570. Stop loss — around 0.8400.
면책 조항: 본 게시글에 표현된 견해는 전적으로 작성자의 견해이며 Followme의 공식 입장을 대변하지 않습니다. Followme는 제공된 정보의 정확성, 완전성 또는 신뢰성에 대해 책임을 지지 않으며, 서면으로 명시적으로 언급되지 않는 한 해당 내용을 기반으로 취해진 어떠한 조치에 대해서도 책임을 지지 않습니다.

