


| Scenario | |
|---|---|
| Timeframe | Weekly |
| Recommendation | BUY STOP |
| Entry Point | 406.30 |
| Take Profit | 421.88, 437.50 |
| Stop Loss | 395.10 |
| Key Levels | 375.00, 390.62, 406.25, 421.88, 437.50 |
| Alternative scenario | |
|---|---|
| Recommendation | BUY LIMIT |
| Entry Point | 375.00 |
| Take Profit | 421.88, 437.50 |
| Stop Loss | 365.00 |
| Key Levels | 375.00, 390.62, 406.25, 421.88, 437.50 |
Current trend
The shares of The Home Depot Inc., the largest home improvement company, are growing within the long-term upward trend, reaching 52-week highs of 401.08.
The prices are supported by the easing of the monetary policy of the US Fed, which can significantly affect the growth of the profits of the world leader in the trade of goods for home and repair. Experts expect that the reduction in the interest rate will ease the pressure on the labor market and the construction sector, as a result of which the volume of new home sales will increase, supporting the demand for the assortment of The Home Depot Inc. Earlier, the head of the corporation Ted Decker noted that the peak cost of borrowing and economic uncertainty significantly restrain household spending on home improvement.
The financial statements for the previous quarter were also positive, further supporting the issuer’s securities: revenue amounted to 43.18B dollars, 0.6% more than last year, and earnings per share were 4.67 dollars compared to 4.65 dollars.
In general, fundamental factors remain positive, making the positive dynamics quite likely.
Support and resistance
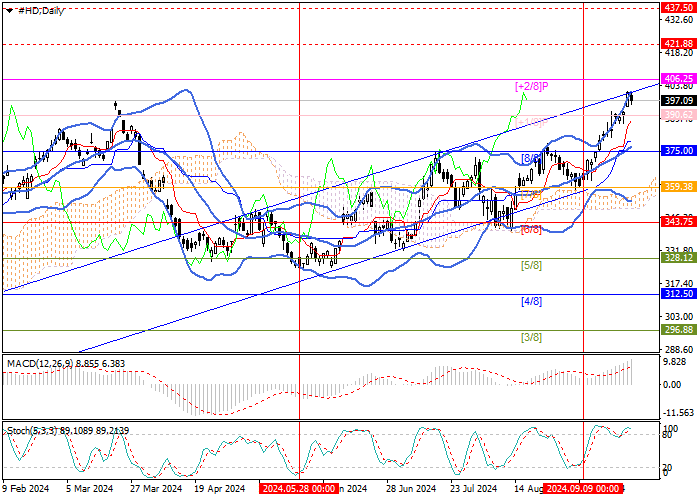
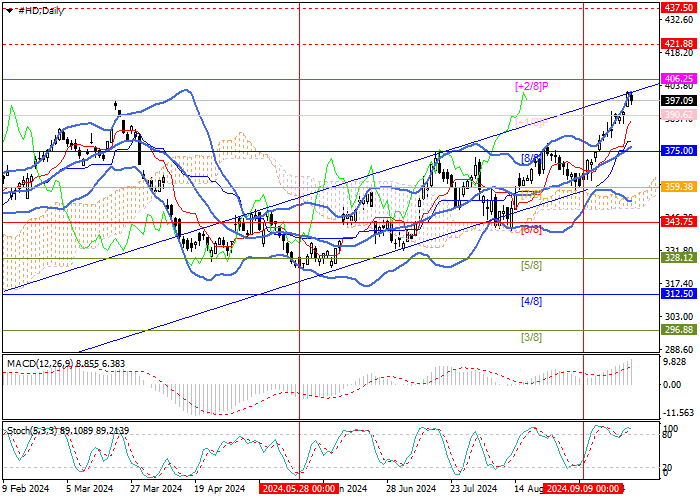
The trading instrument is close to the upper border of the ascending channel. After consolidation above, it may grow to the area of 421.88 (Murrey level [ 2/8], H4) and 437.50 (Murrey level [ 2/8], W1). After a breakdown of 390.62 (Murrey level [ 1/8]), a correction to the middle line of Bollinger bands 375.00 (Murrey level [8/8]) may follow.
Technical indicators reflect that the upward trend will continue. Bollinger Bands and Stochastic are pointing upwards, and the MACD histogram is increasing in the positive zone.
Resistance levels: 406.25, 421.88, 437.50.
Support levels: 390.62, 375.00.
Trading tips
Long positions may be opened above 406.25 or when the price reverses around 375.00, with the targets at 421.88 and 437.50. Stop losses are 395.10 and 365.00, respectively. Implementation period: 5–7 days.
면책 조항: 본 게시글에 표현된 견해는 전적으로 작성자의 견해이며 Followme의 공식 입장을 대변하지 않습니다. Followme는 제공된 정보의 정확성, 완전성 또는 신뢰성에 대해 책임을 지지 않으며, 서면으로 명시적으로 언급되지 않는 한 해당 내용을 기반으로 취해진 어떠한 조치에 대해서도 책임을 지지 않습니다.

