Price is in correction zone, possibility of increase is maintained.
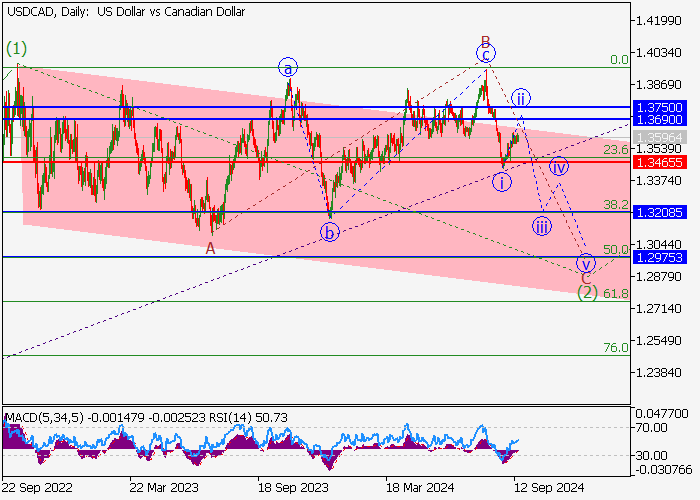
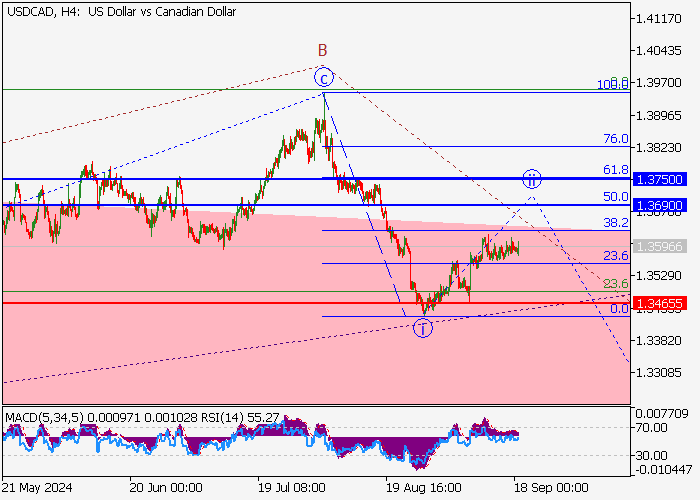
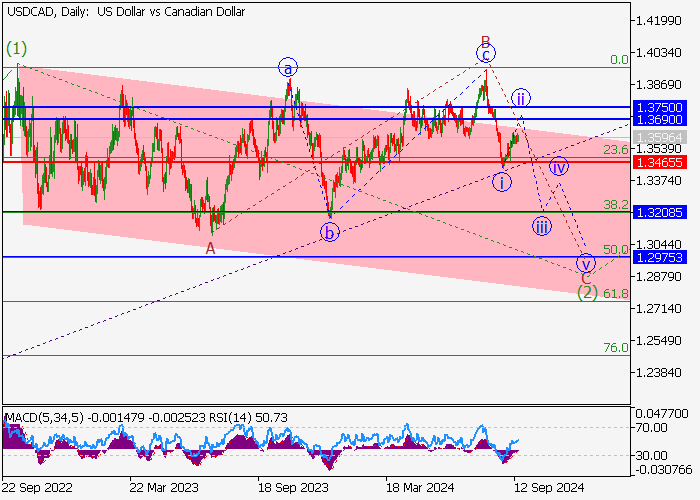
On the daily chart, the first bullish wave of the major level (1) of 5 has formed, and is continuing to develop a correction in the form of the second wave (2) of 5. Currently, wave C of (2) is recorded, which has completed wave i of C and is developing a correction in the form of wave ii of C. If this assessment is correct, the USD/CAD pair will rise to the zone of 1.3690–1.3750. The maximum stop loss for this scenario is 1.3465.
Main script
Consider opening a buy order above 1.3465 with a target to take profit in the 1.3690–1.3750 zone. Timeframe: 7 days or more.
Alternative scenario
The breakout and consolidation of the price below the 1.3465 level allowed the trading instrument to continue the downtrend to the 1.3208–1.2975 zone.
면책 조항: 본 게시글에 표현된 견해는 전적으로 작성자의 견해이며 Followme의 공식 입장을 대변하지 않습니다. Followme는 제공된 정보의 정확성, 완전성 또는 신뢰성에 대해 책임을 지지 않으며, 서면으로 명시적으로 언급되지 않는 한 해당 내용을 기반으로 취해진 어떠한 조치에 대해서도 책임을 지지 않습니다.