


| Scenario | |
|---|---|
| Timeframe | Weekly |
| Recommendation | BUY STOP |
| Entry Point | 34.90 |
| Take Profit | 36.02, 37.17 |
| Stop Loss | 34.31 |
| Key Levels | 31.95, 32.71, 33.78, 34.85, 36.02, 37.17 |
| Alternative scenario | |
|---|---|
| Recommendation | SELL STOP |
| Entry Point | 33.75 |
| Take Profit | 32.71, 31.95 |
| Stop Loss | 34.31 |
| Key Levels | 31.95, 32.71, 33.78, 34.85, 36.02, 37.17 |
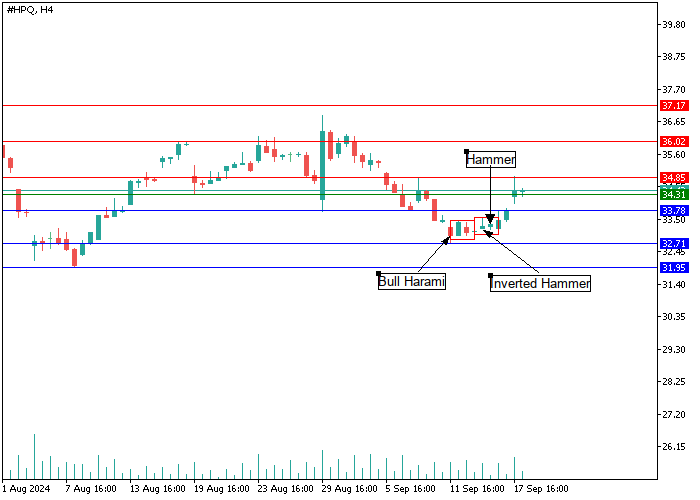
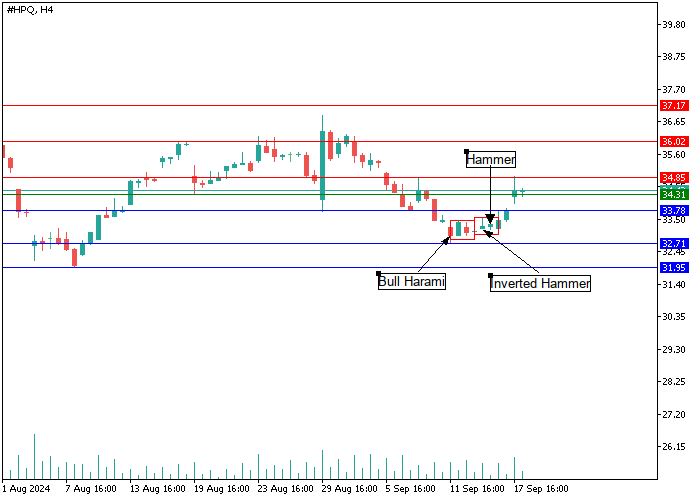
Hewlett-Packard Co., H4
The H4 chart of shares of Hewlett-Packard Co., an American giant in the field of information technology, shows the construction of a "Bull Harami" candlestick analysis pattern near the support level of 32.71, which marked the beginning of the development of positive dynamics, and also shows the formation of reversal patterns "Hammer" and "Inverted Hammer", which signal to market participants that the asset reached the area of low prices and the trend changed to a positive one. The appearance of a price gap of 33.78–34.31 allowed the "bulls" to improve their positions, forming a support level of 33.78 for further price recovery. In the current situation, a more likely development scenario is a further increase in quotes to the key resistance level of 34.85, overcoming which will become a catalyst for opening long positions with targets in the area of 36.02–37.17. If the "bears" manage to consolidate their positions below the support level of 33.78, this may become a driver of further price decline towards the targets of 32.71–31.95.
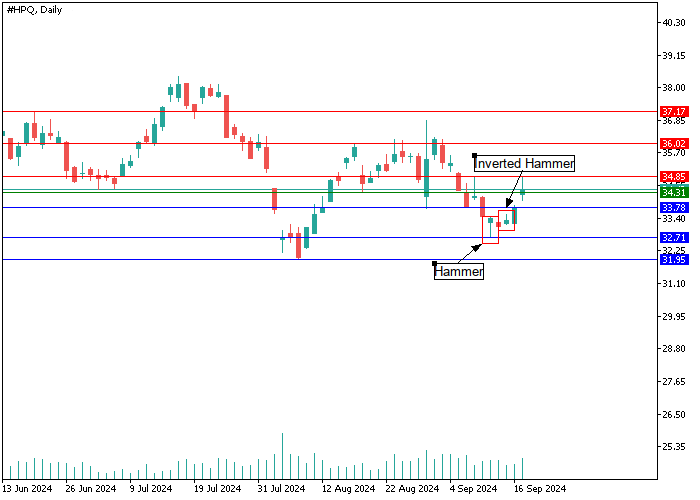
Hewlett-Packard Co., D1
On the D1 chart of the asset, "bullish" signals are formed in the form of reversal patterns of the candlestick analysis "Hammer" and "Inverted Hammer" in the range of 32.71–33.78, which signal pressure from buyers and warn of a change in the market trend to an upward one. Most likely, in the near future, the bulls will attempt to restore their lost positions to the resistance level of 34.85, overcoming which will allow them to test the marks in the area of 36.02–37.17.
Support and resistance
Support levels: 33.78, 32.71, 31.95.
Resistance levels: 34.85, 36.02, 37.17.
Trading tips
Long positions can be opened above the 34.85 mark with targets of 36.02, 37.17. Stop-loss – 34.31. Implementation period: 7 days and more.
Short positions can be opened below the level of 33.78 with targets of 32.71, 31.95. Stop-loss – 34.31.
면책 조항: 본 게시글에 표현된 견해는 전적으로 작성자의 견해이며 Followme의 공식 입장을 대변하지 않습니다. Followme는 제공된 정보의 정확성, 완전성 또는 신뢰성에 대해 책임을 지지 않으며, 서면으로 명시적으로 언급되지 않는 한 해당 내용을 기반으로 취해진 어떠한 조치에 대해서도 책임을 지지 않습니다.

