


PENDLE is a DeFi protocol focused on yield trading, allowing users to both fix or leverage their yield. In today’s blog, we’ll explain the daily Elliott Wave structure taking place and show the potential outcome for the token.
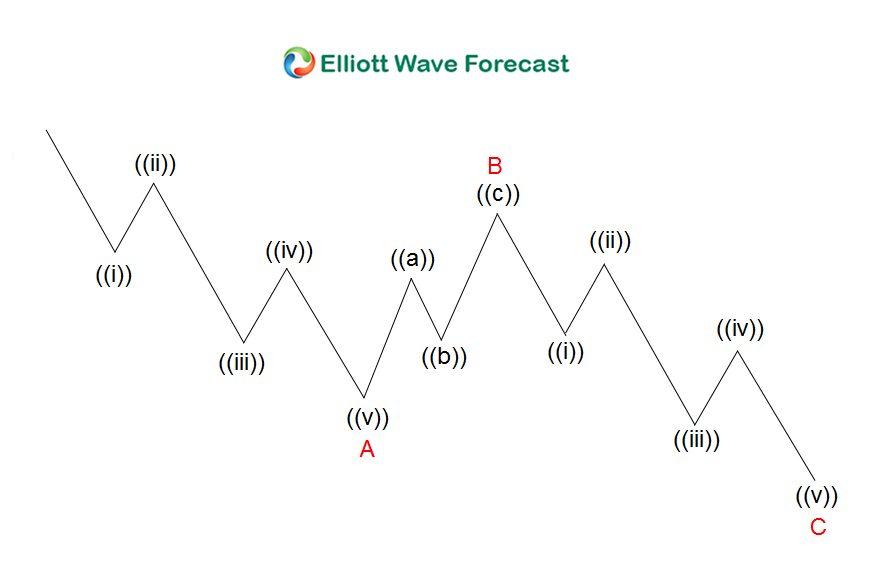
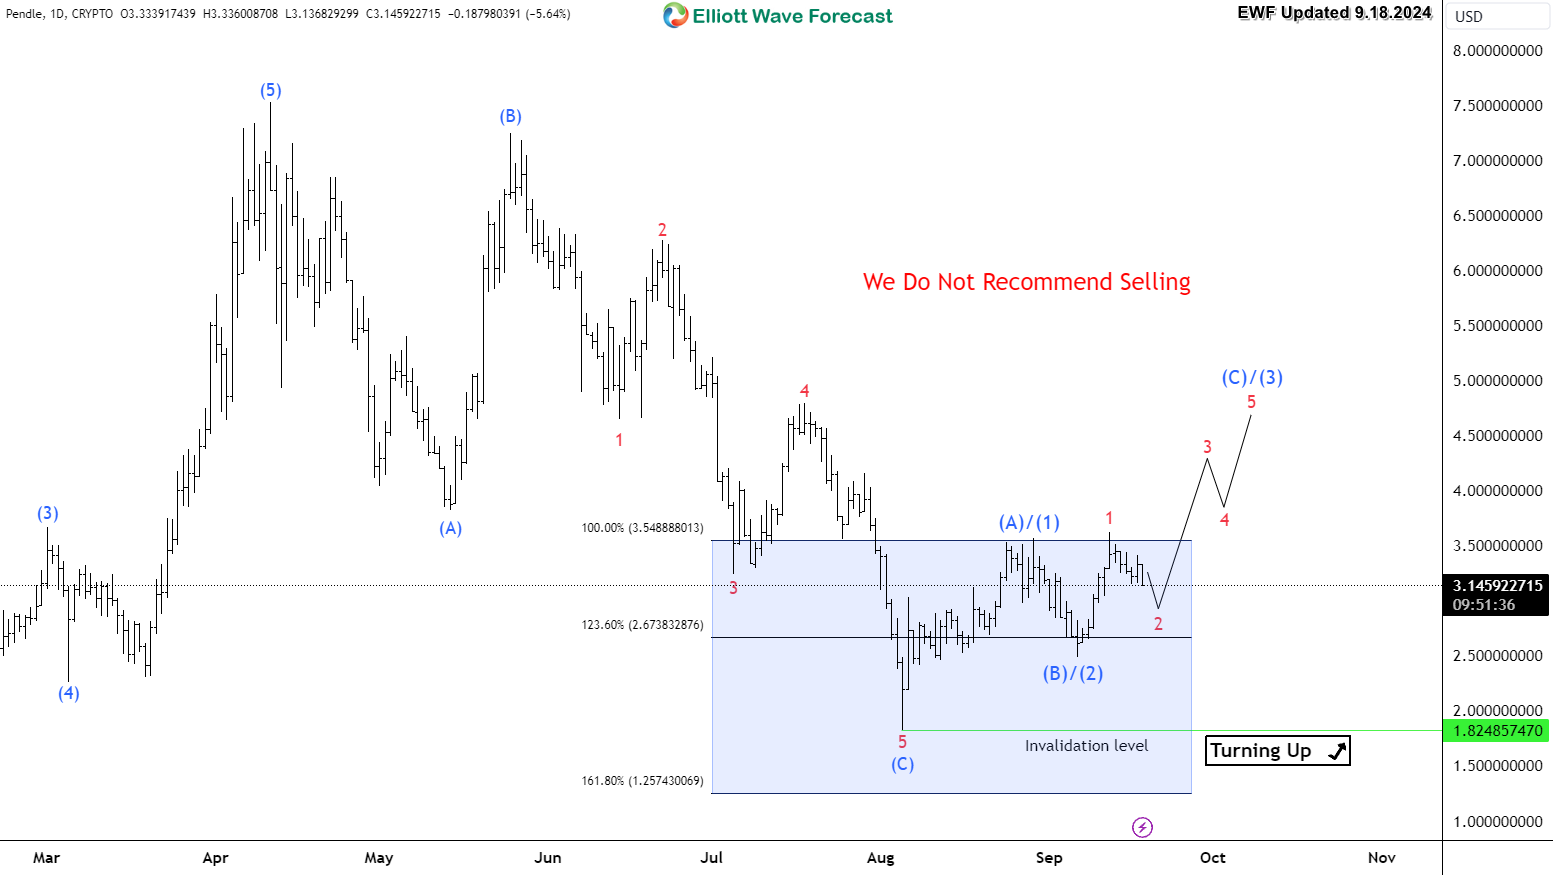
Since April 2024, PENDLE started its correction to the downside and it lost 75% of its value. The move from the peak unfolded within a 3 waves ZigZag structure. This Elliott Wave corrective structure results on a reversal to take place. The token reached the equal legs area at $3.5 – $1.25 from where it ended the daily move to the downside.
The blue box showing in our chart is a technical area where we expect PENDLE to find Buyers and react higher. Up from there, it’s expected to turn to the upside either to start a new 5 waves advance or at least bounce in 3 waves from there.
Elliott Wave ZigZag Structure
PENDLE Daily Chart 9.18.2024
면책 조항: 본 게시글에 표현된 견해는 전적으로 작성자의 견해이며 Followme의 공식 입장을 대변하지 않습니다. Followme는 제공된 정보의 정확성, 완전성 또는 신뢰성에 대해 책임을 지지 않으며, 서면으로 명시적으로 언급되지 않는 한 해당 내용을 기반으로 취해진 어떠한 조치에 대해서도 책임을 지지 않습니다.

