



| Scenario | |
|---|---|
| Timeframe | Weekly |
| Recommendation | BUY STOP |
| Entry Point | 265.05 |
| Take Profit | 283.00 |
| Stop Loss | 255.00 |
| Key Levels | 230.00, 255.00, 265.00, 283.00 |
| Alternative scenario | |
|---|---|
| Recommendation | SELL STOP |
| Entry Point | 254.95 |
| Take Profit | 230.00 |
| Stop Loss | 265.00 |
| Key Levels | 230.00, 255.00, 265.00, 283.00 |
Current trend
Shares of American Express Co., one of the leading American multinational companies providing payment transaction services, are adjusting at 260.00.
Yesterday, statistics on demand for lending services over the past three months were published, which supported positive forecasts for revenue growth in the third quarter: for example, the volume of loans issued to cardholders increased in August to 87.3 billion dollars from 85.9 billion dollars in July and 85.0 billion dollars in June, and the volume of loans for small businesses amounted to 30.1 billion dollars in August, above 29.2 billion dollars in July and 28.6 billion dollars in June. Thus, the total amount of funds disbursed amounted to 117.4 billion dollars in August, after 115.1 billion dollars in July and 113.6 billion dollars in June.
The financial report for the third quarter of American Express Co. will be published on October 18: analysts expect revenue growth from 16.30 billion dollars to 16.68 billion dollars, up from 15.38 billion dollars over the same period a year earlier. Earnings per share (EPS) could be 3.27 dollars, down from 3.49 dollars in the previous quarter and 3.3 dollars a year earlier.
The last dividend payment took place on August 9, when 0.7 dollars per share was sent to investors, which is equivalent to a yield of 1.19%.
Support and resistance
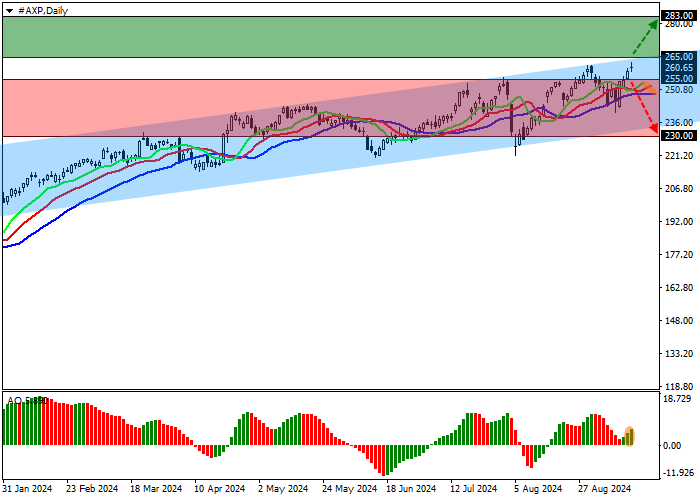
On the D1 chart, quotes are rising, moving away from the support line of the ascending channel with the boundaries of 265.00–235.00.
Technical indicators have long issued a buy signal: the range of EMAs fluctuations on the Alligator indicator is directed upwards, and fast EMAs are far from the signal line, while the AO histogram, trading in a positive zone, forms new ascending bars.
Support levels: 255.00, 230.00.
Resistance levels: 265.00, 283.00.
Trading tips
If the asset continues to grow and the price consolidates above the resistance level of 265.00, one may open long positions with a target of 283.00 and a stop-loss of 255.00. Implementation period: 7 days and more.
If the asset continues to decline and the price consolidates below the support level of 255.00, short positions with a target of 230.00 and a stop-loss of 265.00 will be relevant.
면책 조항: 본 게시글에 표현된 견해는 전적으로 작성자의 견해이며 Followme의 공식 입장을 대변하지 않습니다. Followme는 제공된 정보의 정확성, 완전성 또는 신뢰성에 대해 책임을 지지 않으며, 서면으로 명시적으로 언급되지 않는 한 해당 내용을 기반으로 취해진 어떠한 조치에 대해서도 책임을 지지 않습니다.

