


| Scenario | |
|---|---|
| Timeframe | Intraday |
| Recommendation | BUY |
| Entry Point | 28.45 |
| Take Profit | 29.00 |
| Stop Loss | 27.90 |
| Key Levels | 27.00, 27.00, 27.60, 28.00, 28.30, 28.68, 29.00, 29.35 |
| Alternative scenario | |
|---|---|
| Recommendation | SELL STOP |
| Entry Point | 28.00 |
| Take Profit | 27.30 |
| Stop Loss | 28.30 |
| Key Levels | 27.00, 27.00, 27.60, 28.00, 28.30, 28.68, 29.00, 29.35 |
Current trend
During the Asian session, the XAG/USD pair is showing ambiguous trading dynamics, holding near 28.25. Yesterday, the price was retreating from the lows of August 15. The quotes are under pressure as investors are revising their short-term and medium-term portfolios amid large-scale sales of shares, which also affected commodity markets.
Investor activity is reduced before the key US labor market statistics publication at the end of the week. It may affect the US Fed’s decision on monetary policy at the September meeting. The current dynamics assume an interest rate adjustment of –25 basis points, while the probability of a change in the indicator by –50 basis points does not exceed 35.0%. According to preliminary estimates, the August nonfarm payrolls will increase from 114.0K to 160.0K, average hourly earnings – from 0.2% to 0.3% MoM and from 3.6% to 3.7% YoY, and the unemployment rate may slow down from 4.3% to 4.2%. Weaker data will increase the likelihood of a change in course, supporting the asset.
The correction in the silver contracts market continues. According to the US Commodity Futures Trading Commission (CFTC), last week, net speculative positions in silver increased from 49.3K to 52.2K. As for the dynamics, the “bulls” keep an advantage against a slight increase in demand for contracts. According to the report on positions secured by real money, the balance of the “bulls” is 44.891K against 9.609K of the “bears.” Last week, buyers opened 3.626K deals, while sellers closed 0.342K contracts, which reflects low trading activity.
Support and resistance
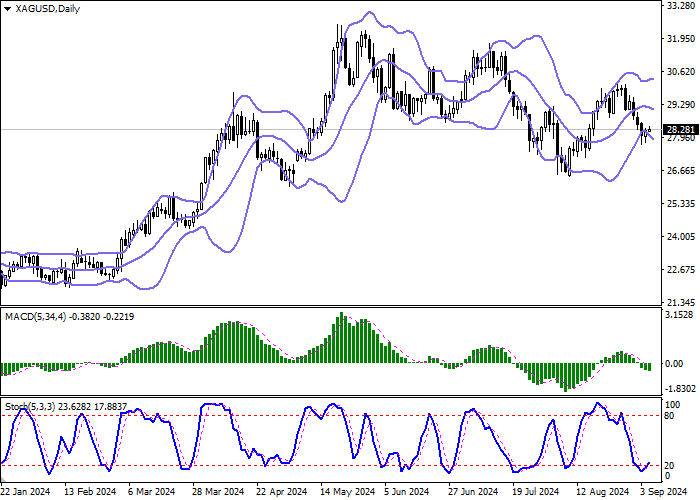
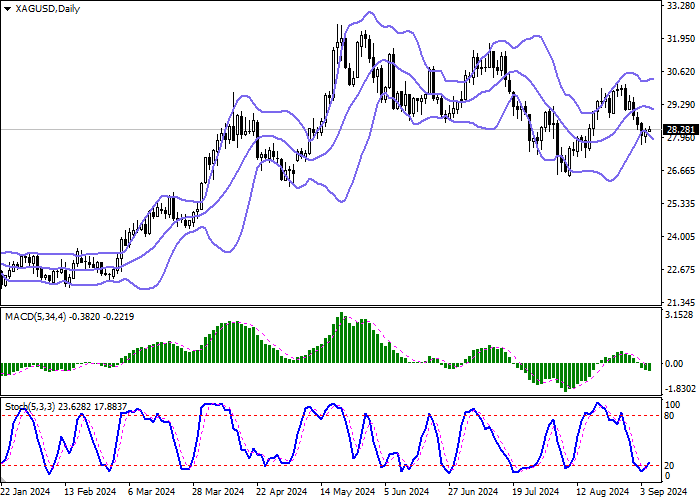
On the daily chart, Bollinger bands are trying to reverse downwards. The price range is expanding from below, letting the “bears” renew local lows. The MACD indicator is declining, keeping a poor sell signal (the histogram is below the signal line). Stochastic has reversed around near the lows and is trying to leave the oversold area with a signal in favor of the development of an upward corrective trend in the ultra-short term.
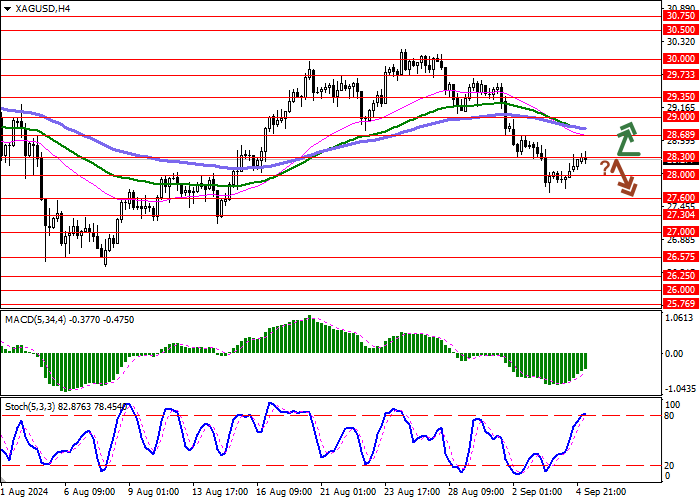
Resistance levels: 28.30, 28.68, 29.00, 29.35.
Support levels: 28.00, 27.60, 27.30, 27.00.
Trading tips
Long positions may be opened after a breakout of 28.30, with the target at 29.00. Stop loss — 27.90. Implementation period: 1–2 days.
Short positions may be opened after a rebound from 28.30 and a breakdown of 28.00, with the target at 27.30. Stop loss — 28.30.
면책 조항: 본 게시글에 표현된 견해는 전적으로 작성자의 견해이며 Followme의 공식 입장을 대변하지 않습니다. Followme는 제공된 정보의 정확성, 완전성 또는 신뢰성에 대해 책임을 지지 않으며, 서면으로 명시적으로 언급되지 않는 한 해당 내용을 기반으로 취해진 어떠한 조치에 대해서도 책임을 지지 않습니다.

