


| Scenario | |
|---|---|
| Timeframe | Weekly |
| Recommendation | BUY STOP |
| Entry Point | 41076.0 |
| Take Profit | 42456.0 |
| Stop Loss | 40400.0 |
| Key Levels | 39190.0, 40430.0, 41076.0, 42456.0 |
| Alternative scenario | |
|---|---|
| Recommendation | SELL STOP |
| Entry Point | 40430.0 |
| Take Profit | 39190.0 |
| Stop Loss | 41000.0 |
| Key Levels | 39190.0, 40430.0, 41076.0, 42456.0 |
Current trend
The Dow Jones index is correcting in a local trend at 40802.0, supported by stable reporting from component companies.
Thus, business software developer Intuit Inc. reported revenue of 3.18B dollars, which was better than last year’s figure of 2.70B dollars, while earnings per share amounted to 1.99 dollars compared to 1.65 dollars. Internet technology company NetEase Inc. reported revenue of 25.49B dollars, exceeding 24.01B dollars in the same period a year earlier, and earnings per share were recorded around 12.05 dollars, below 14.01 dollars last year. And finally, the revenue of the American chain of discount department stores Ross Stores Inc. reached 5.3B dollars, surpassing 4.93B dollars in 2023, and earnings per share were 1.59 dollars compared to 1.32.
In anticipation of the speech of the US Fed Chairman Jerome Powell at the Economic Symposium in Jackson Hole, bond the quotes slowed their fluctuations slightly but the downward trend still remains: 10-year bonds are trading today at a yield of 3.850%, inferior to 3.928% last week, and 20-year bonds have adjusted to 4.215% from 4.268% previously.
The leaders of growth in the index are: JPMorgan Chase & Co. ( 0.95%), American Express Co. ( 0.59%), Johnson & Johnson ( 0.57%).
Among the leaders of decline are: Intel Corp. (–6.12%), Amazon.com Inc. (–2.21%), Microsoft Corp. (–2.03%).
Support and resistance
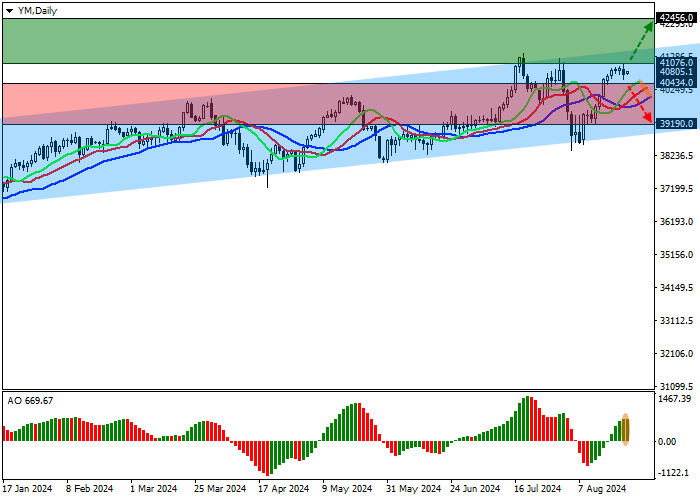
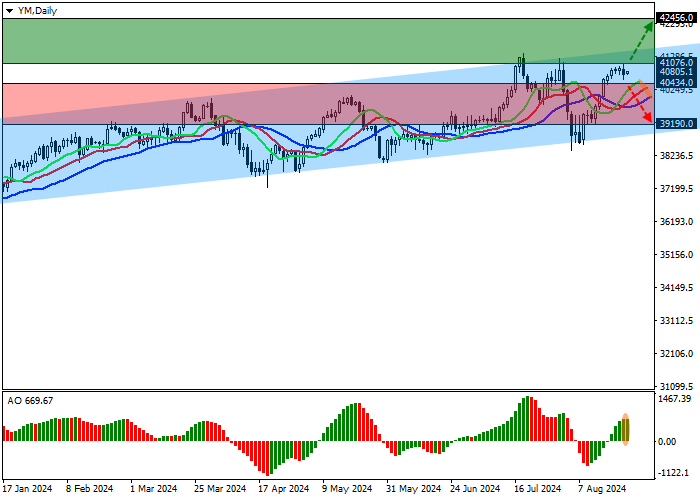
On the daily chart, the quotes continue their correction dynamics and are again approaching the resistance line of the ascending channel 41800.0–39000.0.
Technical indicators maintain a buy signal, which is gradually strengthening: the EMA oscillation range of the Alligator indicator is expanding, and the AO oscillator histogram is forming new correction bars, staying above the transition level.
Support levels: 40430.0, 39190.0.
Resistance levels: 41076.0, 42456.0.
Trading tips
Long positions may be opened after overcoming the resistance level of 41076.0, with the target at 42456.0 and stop loss 40400.0. Implementation period: 7 days or more.
Short positions may be opened after the price consolidates below the support level of 40430.0, with the target at 39190.0. Stop loss is 41000.0.
면책 조항: 본 게시글에 표현된 견해는 전적으로 작성자의 견해이며 Followme의 공식 입장을 대변하지 않습니다. Followme는 제공된 정보의 정확성, 완전성 또는 신뢰성에 대해 책임을 지지 않으며, 서면으로 명시적으로 언급되지 않는 한 해당 내용을 기반으로 취해진 어떠한 조치에 대해서도 책임을 지지 않습니다.

