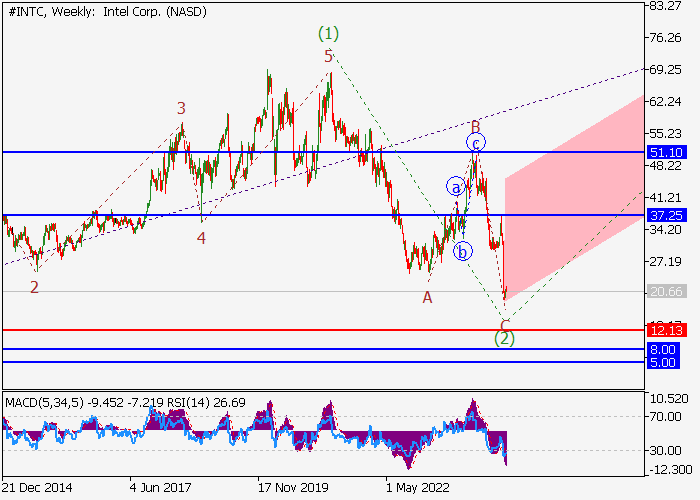
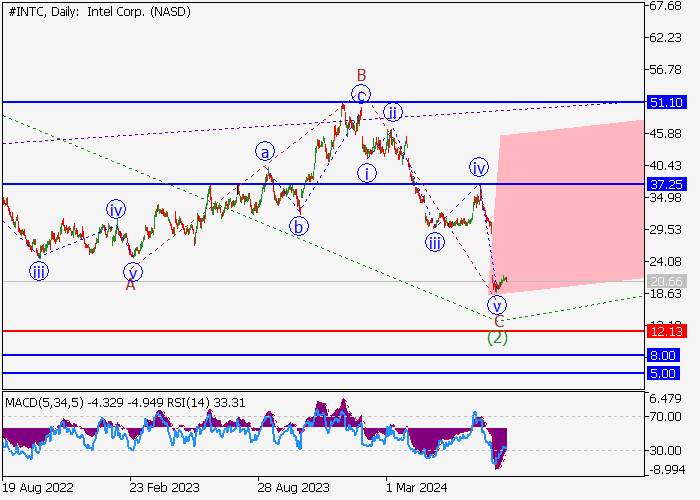
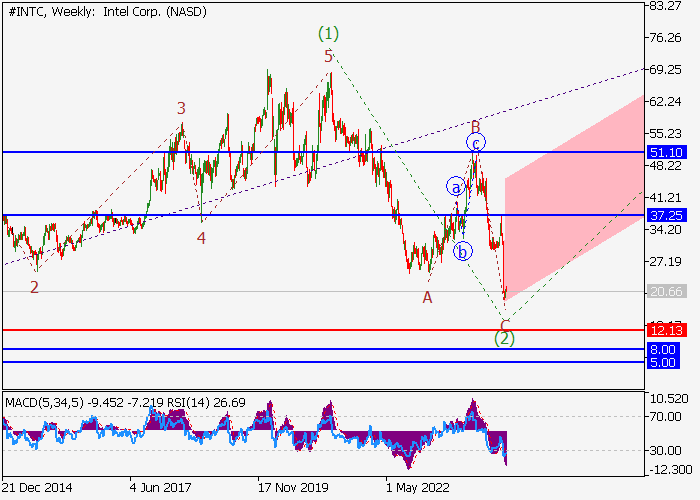
On the weekly chart, the first wave of the higher level (1) formed, and a correction ended as the second wave (2). Now, on the daily chart, the wave C of (2) has formed, within which the fifth wave of the lower level v of C of (2) is developing. If the assumption is correct, the price of the asset will grow within the wave (3) to the area of 37.25–51.10. In this scenario, critical stop loss level is 12.13.
Main scenario
Long positions will become relevant above the level of 12.13 with the targets at 37.25–51.10. Implementation period: 7 days and more.
Alternative scenario
A breakout and the consolidation of the price below the level of 12.13 will let the asset go down to the area of 8.00–5.00.
면책 조항: 본 게시글에 표현된 견해는 전적으로 작성자의 견해이며 Followme의 공식 입장을 대변하지 않습니다. Followme는 제공된 정보의 정확성, 완전성 또는 신뢰성에 대해 책임을 지지 않으며, 서면으로 명시적으로 언급되지 않는 한 해당 내용을 기반으로 취해진 어떠한 조치에 대해서도 책임을 지지 않습니다.