Hello, traders. Here’s a new blog post where we discuss how Elliottwave-Forecast members found an opportunity in the GBPNZD forex pair. First, we’ll explain why we recommended this trade to our members. Then, we'll explore the trade's potential and how we want our members to manage it.
Let’s start with the background. We begin by analyzing the weekly chart to get an overview of the long-term price action of this currency pair. Identifying the long-term cycle is crucial, as we always aim to trade in the direction of the prevailing market trend. After reviewing the weekly chart, we narrow it down to the 1-hour chart to help members see the safer trading path.
Along the bullish path, we like to buy pullbacks in 3, 7, or 11 swings at the extreme. Conversely, when the market is bearish, we look for extreme bounces to sell from. It’s that simple!
GBPNZD Elliott Wave Analysis, Weekly Chart, 08.10.2024
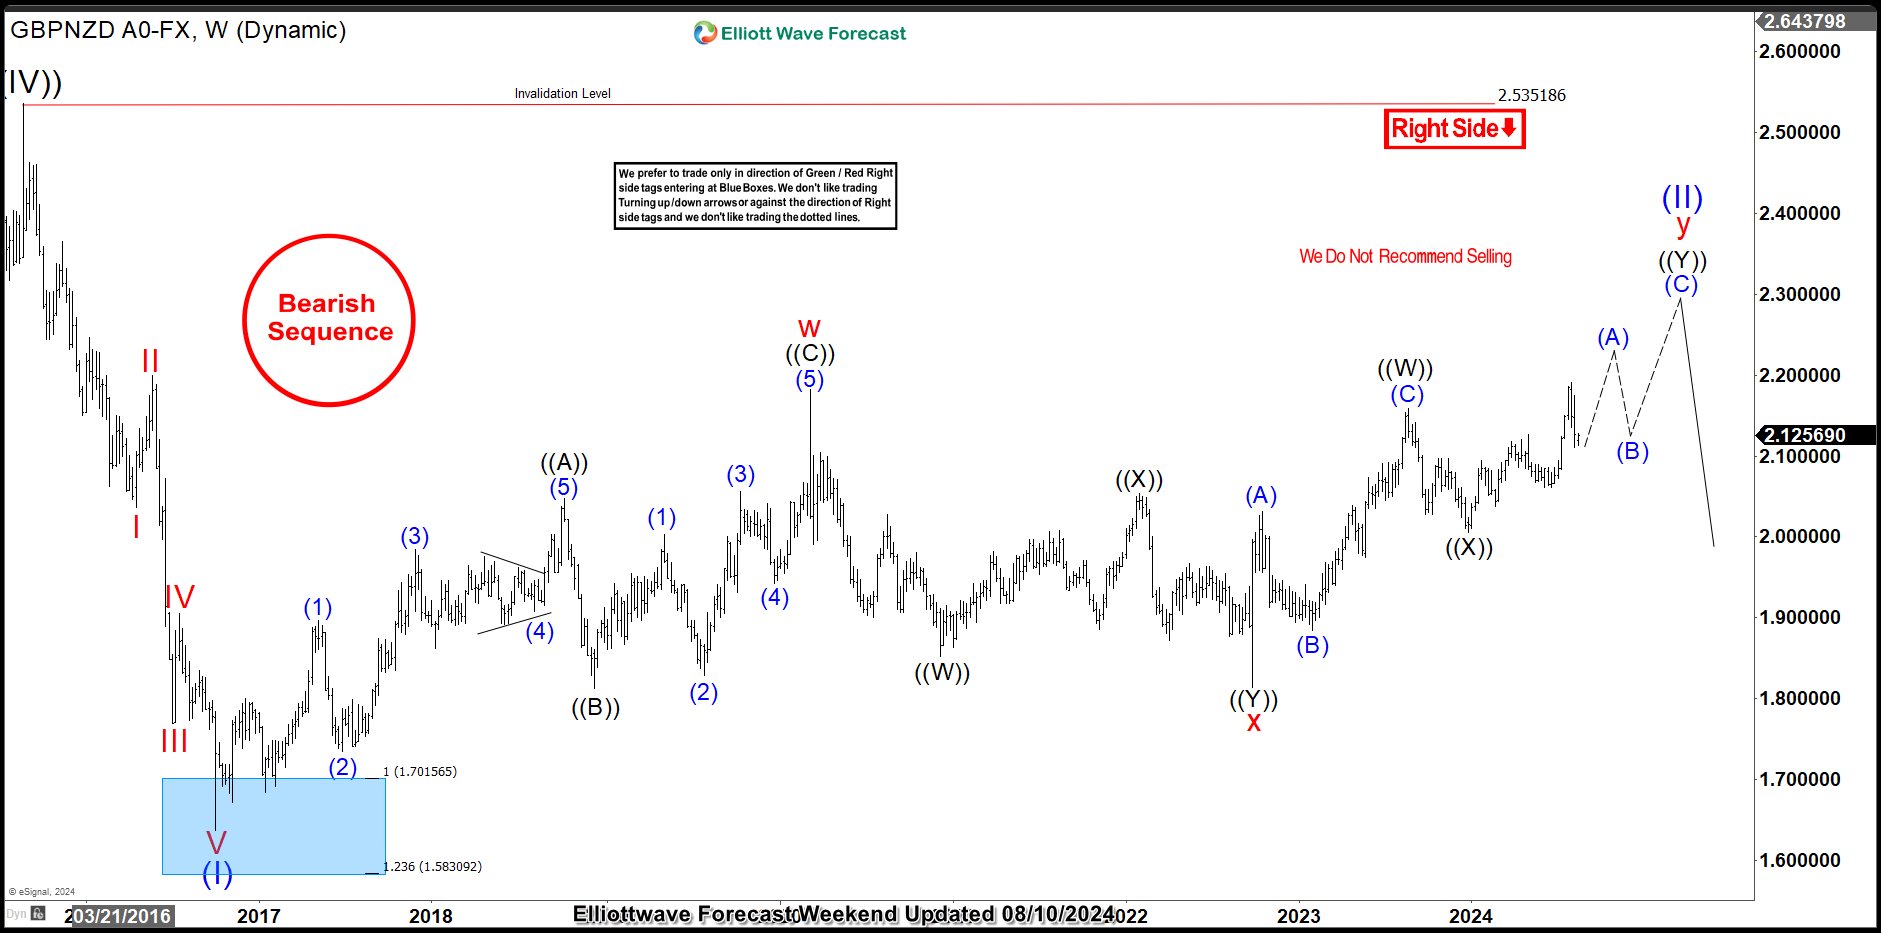
On 08.10.2024, we shared the chart above with our members. Since the October 2016 low, when the supercycle degree wave (I) ended, the GBPNZD currency pair has been trending upward. This is part of a corrective cycle for wave (II) of the supercycle degree, which has lasted over 8 years. One thing is clear: the sequence remains bullish. The price continues to break previous highs and lows, making new ones. From an Elliott Wave perspective, we identified this movement as a double zigzag structure. Wave w of (II) was completed in March 2020, and wave x finished in September 2022. Since September 2022, wave y of (II) has been evolving into another double zigzag.
By our projection, wave y of (II) could reach the equal leg of wave w at around 2.38. Therefore, there's still room for further rallies. Not only has wave y of (II) not yet reached its target, but the developing structure is also incomplete. Currently, the price is in wave (A) of ((Y)) of y of (II). With this in mind, we advised subscribers to focus only on buying pullbacks in 3, 7, or 11 swings. When there's a buying opportunity, members can identify the entry zone using the blue box on our charts. Additionally, we share entry and exit prices in the live trading room. We had one such opportunity on 08.13.2024.
GBPNZD Elliott Wave Analysis, 1-Hour Chart 08.13.2024
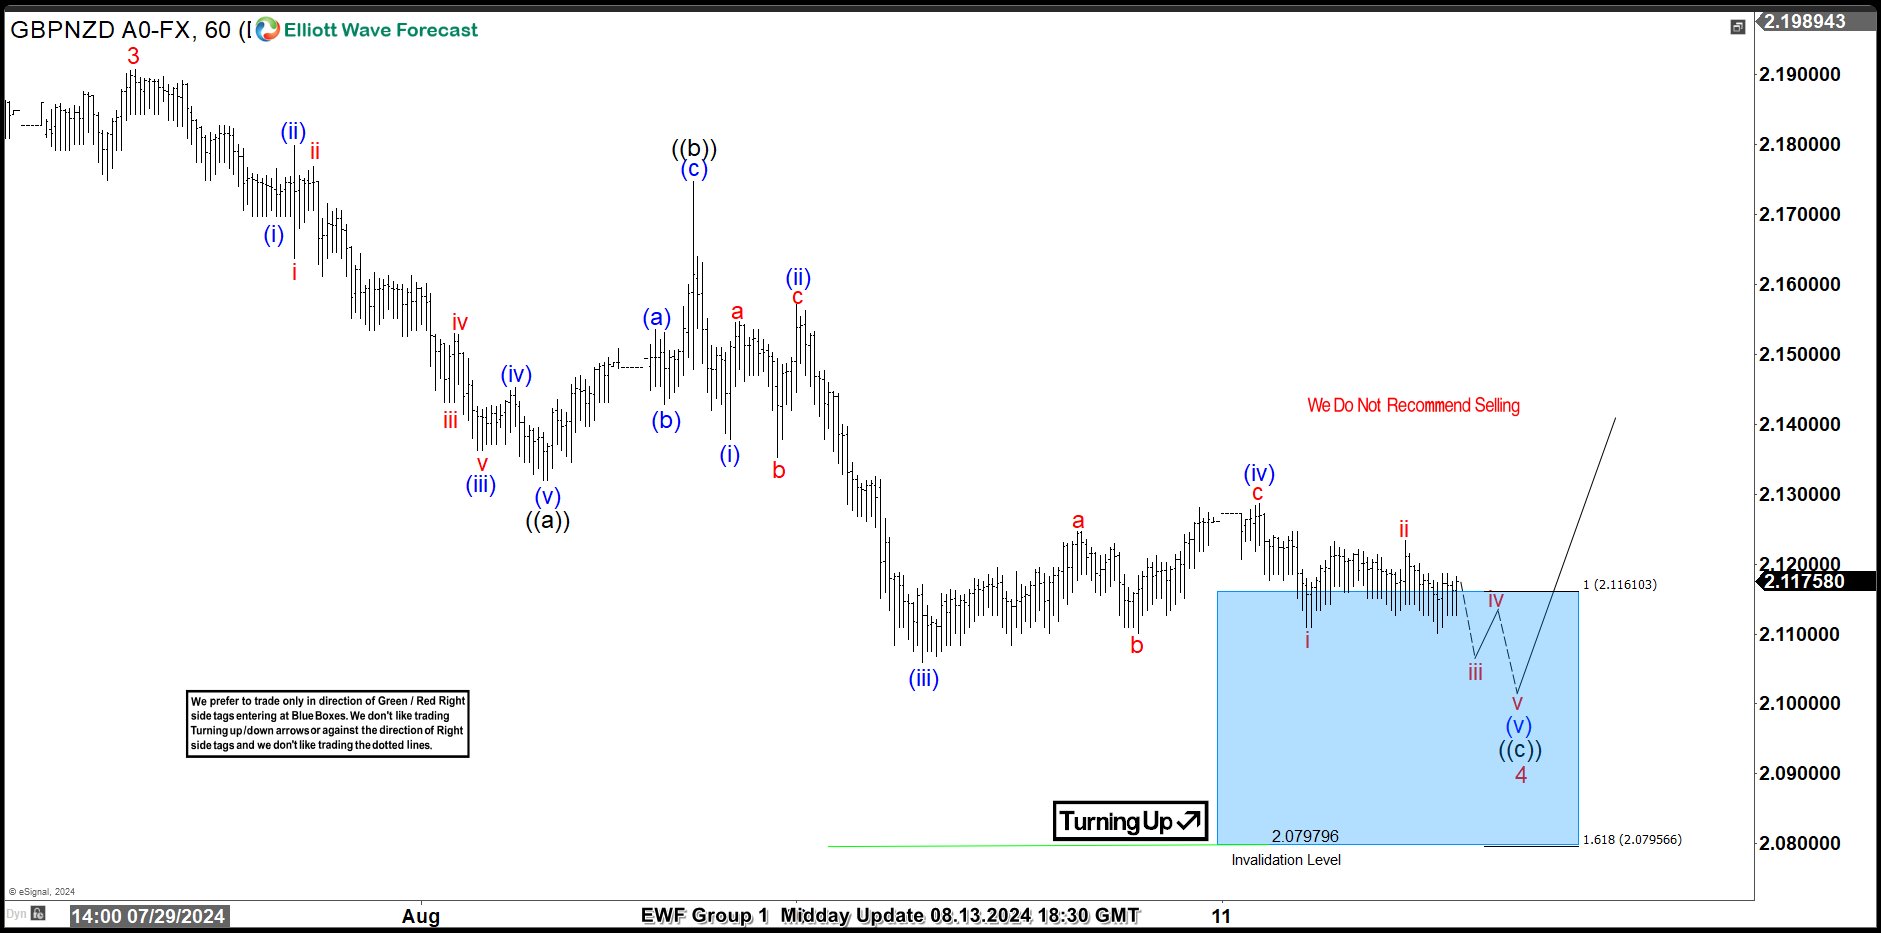
We shared the 1-hour chart above with members on 08.13.2024. At that time, the pair had just reached its highest price since March 2020. A pullback began, which we identified as a double zigzag pattern for wave 4 of (A). We pinpointed the extreme of the pullback at 2.11610-2.0795 and recommended that members enter a buy trade from this zone. We anticipated an impulse recovery for wave 5 or at least a 3-swing bounce from the box.
GBPNZD Elliott Wave Analysis, 1-Hour Chart 08.14.2024
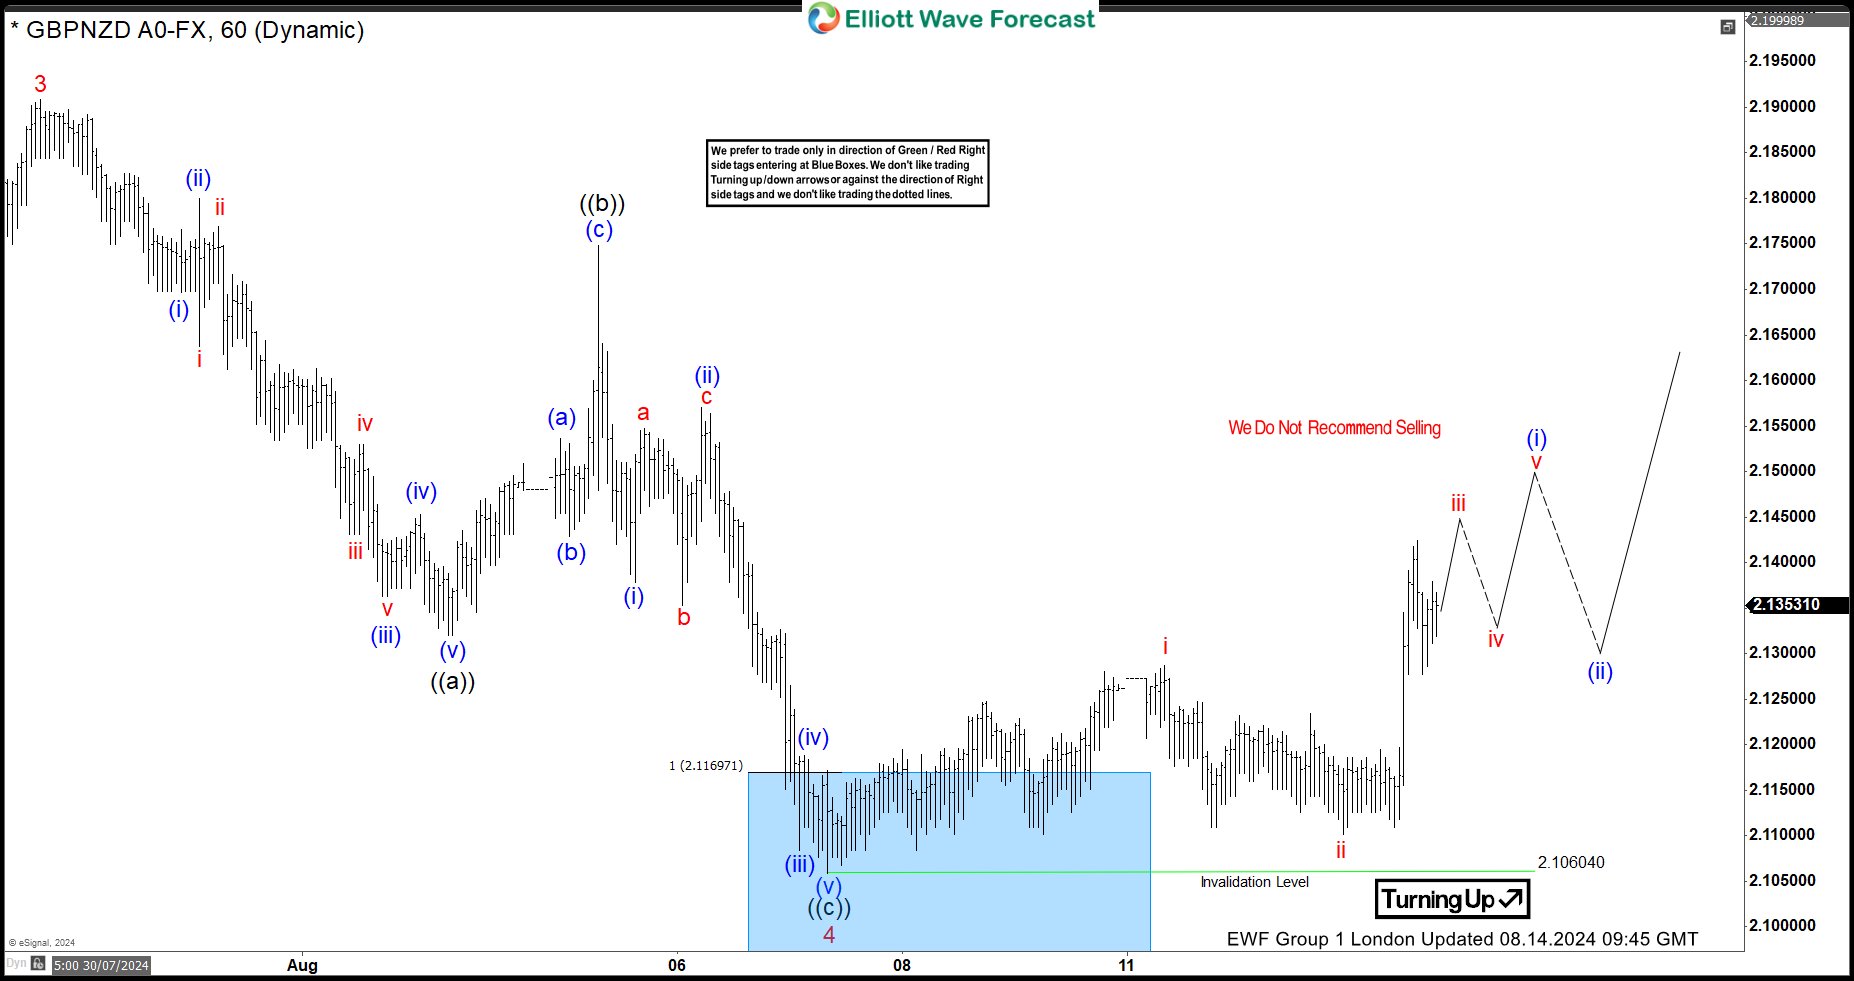
We shared the chart above with members on 08.14.2024, a day after entry. The pair is now moving away from the blue box. Members have closed half of their positions to lock in some profit. They have also adjusted the stop for the remaining trade to just below wave ii of (i), around breakeven.
As long as the price stays above the wave ii low, buyers will continue to hold until we reach the target we set in the trading room. However, if a corrective bounce occurs and the price drops below the stop, traders will keep the small profit already secured. Our analysts guide members through the entire process—identifying a clear sequence, making blue box entries, and managing the trade.
면책 조항: 본 게시글에 표현된 견해는 전적으로 작성자의 견해이며 Followme의 공식 입장을 대변하지 않습니다. Followme는 제공된 정보의 정확성, 완전성 또는 신뢰성에 대해 책임을 지지 않으며, 서면으로 명시적으로 언급되지 않는 한 해당 내용을 기반으로 취해진 어떠한 조치에 대해서도 책임을 지지 않습니다.

더 오래된 의견은 없습니다. 소파를 가장 먼저 잡으십시오.