


· Views 107
면책 조항: 본 게시글에 표현된 견해는 전적으로 작성자의 견해이며 Followme의 공식 입장을 대변하지 않습니다. Followme는 제공된 정보의 정확성, 완전성 또는 신뢰성에 대해 책임을 지지 않으며, 서면으로 명시적으로 언급되지 않는 한 해당 내용을 기반으로 취해진 어떠한 조치에 대해서도 책임을 지지 않습니다.
이 글이 마음에 드시나요? 작성자에게 팁을 보내 감사의 마음을 전하세요.
| Scenario | |
|---|---|
| Timeframe | Weekly |
| Recommendation | BUY STOP |
| Entry Point | 125.05 |
| Take Profit | 131.25 |
| Stop Loss | 120.00 |
| Key Levels | 100.00, 106.25, 115.62, 125.00, 131.25 |
| Alternative scenario | |
|---|---|
| Recommendation | BUY LIMIT |
| Entry Point | 115.62 |
| Take Profit | 131.25 |
| Stop Loss | 111.00 |
| Key Levels | 100.00, 106.25, 115.62, 125.00, 131.25 |
Current trend
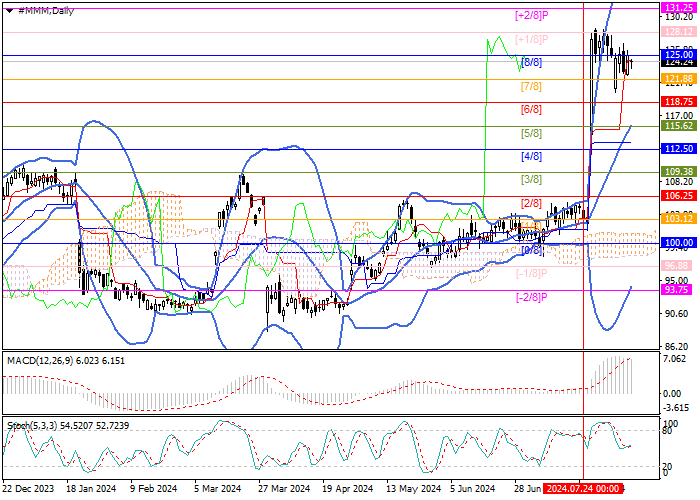
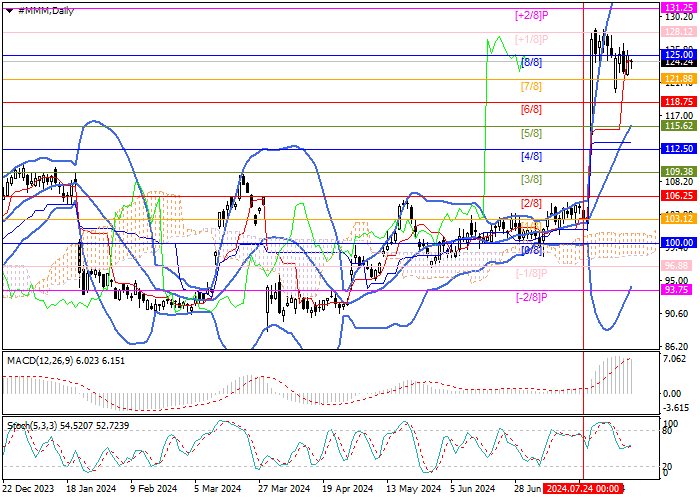
Shares of 3M Co., an American diversified innovative manufacturing company, rose significantly at the end of last month, allowing a changing of the long-term downward trend. The quotes reversed at 103.12 (Murrey level [1/8]) and rose to the upper border of the Murrey trading range of 125.00 (Murrey level [0/8]), consolidation above which will allow them to reach the target of 131.25 (Murrey level [ 2/8]). In case of a breakdown of 115.62 (Murrey level [5/8]), supported by the middle line of Bollinger Bands, the price may return to 106.25 (Murrey level [2/8]) and 100.00 (Murrey level [0/8]).
Technical indicators point to the formation of an upward trend: Bollinger Bands reversed upwards, the MACD histogram is stable in the positive zone, and Stochastic is horizontal.
Support and resistance
Resistance levels: 125.00, 131.25.
Support levels: 115.62, 106.25, 100.00.
Trading tips
Long positions may be opened above 125.00 or when the price reverses upwards at 115.62, with the target at 131.25 and stop losses of 120.00 and 111.00, respectively. Implementation period: 5–7 days.
면책 조항: 본 게시글에 표현된 견해는 전적으로 작성자의 견해이며 Followme의 공식 입장을 대변하지 않습니다. Followme는 제공된 정보의 정확성, 완전성 또는 신뢰성에 대해 책임을 지지 않으며, 서면으로 명시적으로 언급되지 않는 한 해당 내용을 기반으로 취해진 어떠한 조치에 대해서도 책임을 지지 않습니다.

