



| Scenario | |
|---|---|
| Timeframe | Intraday |
| Recommendation | BUY STOP |
| Entry Point | 147.95 |
| Take Profit | 149.50 |
| Stop Loss | 147.00 |
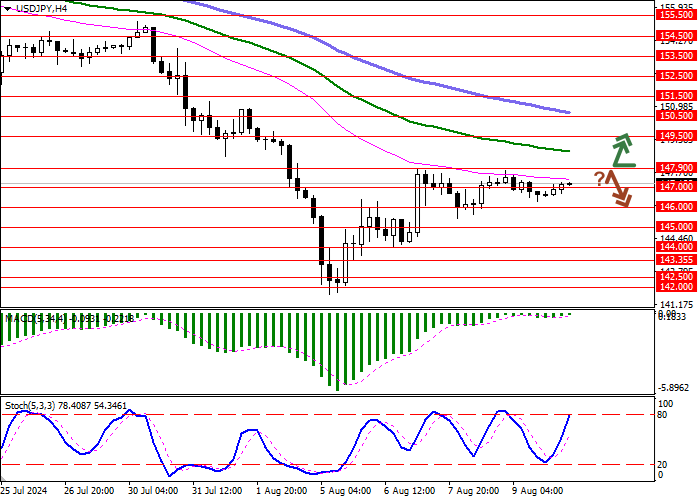
| Key Levels | 144.00, 145.00, 146.00, 147.00, 147.90, 149.50, 150.50, 151.50 |
| Alternative scenario | |
|---|---|
| Recommendation | SELL STOP |
| Entry Point | 147.00 |
| Take Profit | 145.00 |
| Stop Loss | 147.90 |
| Key Levels | 144.00, 145.00, 146.00, 147.00, 147.90, 149.50, 150.50, 151.50 |
Current trend
During the Asian session, the USD/JPY pair is developing the correction trend that formed last week and is testing 147.15 in anticipation of new drivers.
Today, investors will pay attention to the monthly report on the state of the US budget. In July, forecasts suggest an increase in the deficit from –66.0B dollars to –254.3B dollars. Tomorrow, statistics on manufacturing inflation are due, preceding the publication of the consumer price index on Wednesday at 14:30 (GMT 2). It may have a key impact on the decision of US Fed officials on monetary policy at the September meeting. Now, experts are confident of a transition to a “dovish” course, counting on a reduction in the interest rate by both 25 and 50 basis points equally.
Japan will release its corporate goods price index on Tuesday. According to preliminary estimates, the indicator will increase from 0.2% to 0.3% MoM and from 2.9% to 3.0% YoY, confirming the ongoing pressure in the economy. As a result, the Bank of Japan officials may continue to tighten monetary policy. On Thursday, traders will assess the dynamics of gross domestic product (GDP). Experts expect the Q2 value to increase by 2.1% YoY after a decrease of 1.8% earlier and by 0.5% QoQ after a decrease of the same amount earlier.
Support and resistance
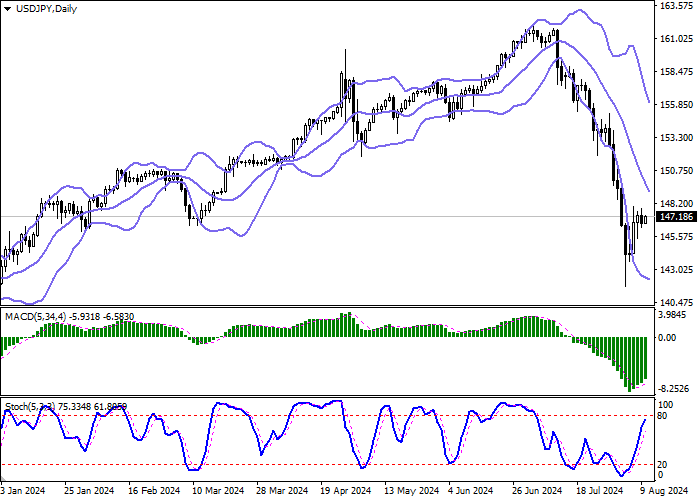
On the daily chart, Bollinger bands are steadily declining: the price range is narrowing, remaining quite spacious for the current market activity level. The MACD indicator reversed towards growth, forming a new buy signal (the histogram is above the signal line). Stochastic is quickly approaching its high marks, indicating that the American currency may become overbought in the ultra-short term.
Resistance levels: 147.90, 149.50, 150.50, 151.50.
Support levels: 147.00, 146.00, 145.00, 144.00.
Trading tips
Long positions may be opened after breaking through 147.90 upwards, with the target at 149.50. Stop loss — 147.00. Implementation period: 2–3 days.
Short positions may be opened after a rebound from 147.90 and breaking through 147.00 downwards, with the target at 145.00. Stop loss — 147.90.
면책 조항: 본 게시글에 표현된 견해는 전적으로 작성자의 견해이며 Followme의 공식 입장을 대변하지 않습니다. Followme는 제공된 정보의 정확성, 완전성 또는 신뢰성에 대해 책임을 지지 않으며, 서면으로 명시적으로 언급되지 않는 한 해당 내용을 기반으로 취해진 어떠한 조치에 대해서도 책임을 지지 않습니다.

