


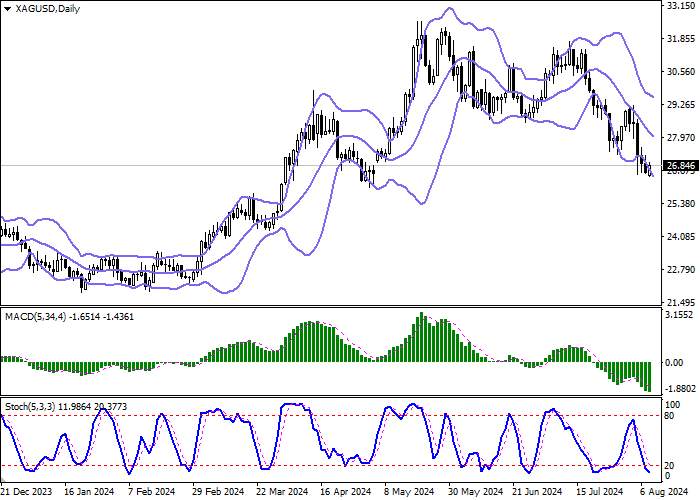
| Scenario | |
|---|---|
| Timeframe | Intraday |
| Recommendation | BUY STOP |
| Entry Point | 27.00 |
| Take Profit | 28.00 |
| Stop Loss | 26.57 |
| Key Levels | 25.76, 26.00, 26.25, 26.57, 27.00, 27.30, 27.60, 28.00 |
| Alternative scenario | |
|---|---|
| Recommendation | SELL STOP |
| Entry Point | 26.55 |
| Take Profit | 25.76 |
| Stop Loss | 27.00 |
| Key Levels | 25.76, 26.00, 26.25, 26.57, 27.00, 27.30, 27.60, 28.00 |
Current trend
During the Asian session, the XAG/USD pair retreats from the lows of May 3, renewed on Thursday, and tests the level of 26.90, while traders evaluate macroeconomic statistics.
After the publication of a poor report on the US labor market at the end of last week, the situation on the market is stabilizing. The ongoing geopolitical tensions provide additional support to the asset. Investors are expecting Iran’s response to the rocket attack that killed the head of the political bureau of the Palestinian Hamas movement, Ismail Haniyeh, which could nullify all efforts aimed at a ceasefire in the Gaza Strip, which, however, has not yet taken place.
Meanwhile, markets have increased expectations for the US Fed interest rate cut, while other global regulators are already on the path to gradually easing monetary policy. The Bank of England officials cut the figure by 25 basis points last week. Today, investors will pay attention to the dynamics of initial and continuing jobless claims: initial jobless claims for the week of August 2 suggest a decrease from 249.0K to 240.0K.
According to the latest report from the US Commodity Futures Trading Commission (CFTC), last week the number of net speculative positions in silver slightly decreased to 49.1K from 51.4K previously. As for the dynamics, the “bulls” keep an advantage against the general outflow of investors from the asset. According to the report on positions secured by real money, their balance is 38.637K against 13.707K for the “bears”. Last week, buyers closed 5.589K transactions, and sellers closed 4.718K contracts, which reflects a downward correction in the asset.
Support and resistance
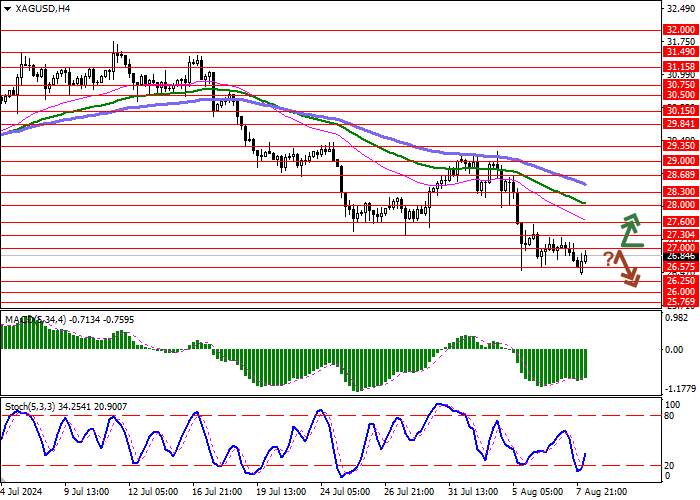
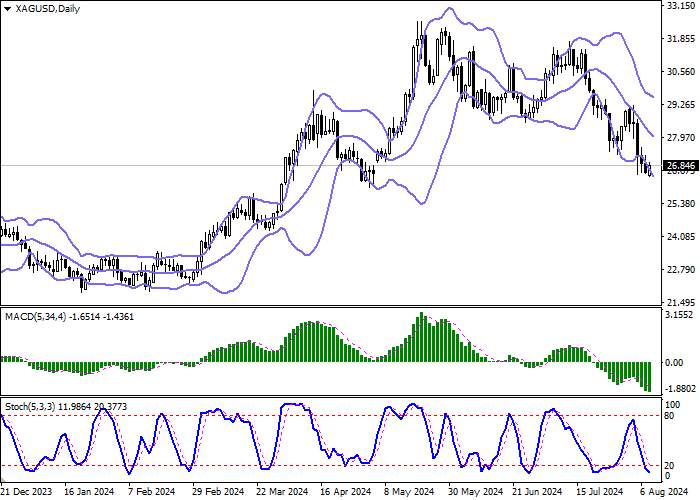
On the daily chart, Bollinger bands are steadily declining. The price range is expanding from below but not as fast as the “bearish” activity. The MACD indicator is declining, keeping a strong sell signal (the histogram is below the signal line). Stochastic is near the lows, which indicates that the instrument may become oversold in the ultra-short term.
Resistance levels: 27.00, 27.30, 27.60, 28.00.
Support levels: 26.57, 26.25, 26.00, 25.76.
Trading tips
Long positions may be opened after a breakout of 27.00, with the target at 28.00. Stop loss — 26.57. Implementation period: 2–3 days.
Short positions may be opened after a rebound from 27.00 and a breakdown of 26.57, with the target at 25.76. Stop loss — 27.00.
면책 조항: 본 게시글에 표현된 견해는 전적으로 작성자의 견해이며 Followme의 공식 입장을 대변하지 않습니다. Followme는 제공된 정보의 정확성, 완전성 또는 신뢰성에 대해 책임을 지지 않으며, 서면으로 명시적으로 언급되지 않는 한 해당 내용을 기반으로 취해진 어떠한 조치에 대해서도 책임을 지지 않습니다.

더 오래된 의견은 없습니다. 소파를 가장 먼저 잡으십시오.