
| Scenario | |
|---|---|
| Timeframe | Weekly |
| Recommendation | SELL STOP |
| Entry Point | 7110.0 |
| Take Profit | 6890.0 |
| Stop Loss | 7200.0 |
| Key Levels | 6890.0, 7110.0, 7250.0, 7430.0 |
| Alternative scenario | |
|---|---|
| Recommendation | BUY STOP |
| Entry Point | 7250.0 |
| Take Profit | 7430.0 |
| Stop Loss | 7150.0 |
| Key Levels | 6890.0, 7110.0, 7250.0, 7430.0 |
Current trend
The CAC 40 index is being adjusted at 7191.0: French stock indicators are actively declining, and investors are again focused on the reporting of component companies and dynamics in the domestic bond market.
Yesterday, the financial results of the pharmaceutical company Cellectis SA were published, reflecting revenue growth to 8.69 million euros from 6.01 million euros, recording positive dynamics for four consecutive quarters. Nevertheless, in the second quarter, the company again made a loss of 0.2561 euros per share, which was inferior to the previous figure of 0.074 euros in profit (EPS). Today, investors will pay attention to the report of luxury alcohol producer Remy Cointreau SA: analysts expect revenue of 223.38 million euros, which is lower than 237.50 million euros in the previous quarter and 257.50 million euros over the same period a year earlier.
The situation on the bond market also does not contribute to the growth of the index quotes: the yield rate on 10-year debt securities decreased to 2.951% from 3.033%, on 20-year old — to 3.261% from 3.335%, and on 30-year old — to 3.464% from 3.513%.
The growth leaders in the index are ArcelorMittal SA ( 2.52%), Airbus Group SE ( 1.95%), Publicis Groupe ( 1.66%).
Among the leaders of the decline are Teleperformance SE (-2.92%), Kering SA (-2.58%), Carrefour SA (-1.61%), Edenred SA (-1.40%).
Support and resistance
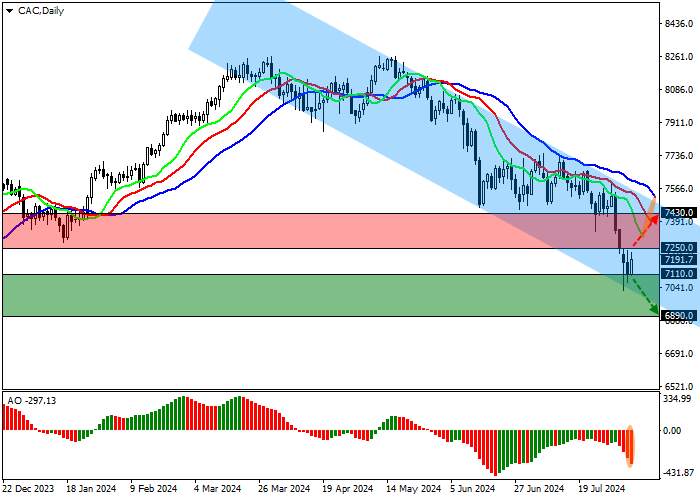
On the D1 chart, CAC 40 quotes are approaching the support line of the descending channel with the boundaries of 7430.0–6890.0.
Technical indicators strengthen the downward signal, accelerating more and more actively: the fast EMAs on the Alligator indicator move away from the signal line, expanding the range of oscillation, and the AO histogram, being far from the transition level, continues to form descending bars.
Support levels: 7110.0, 6890.0.
Resistance levels: 7250.0, 7430.0.
Trading tips
In the event of a reversal and continued decline of the asset, as well as price consolidation below the support level of 7110.0, sell positions with the target of 6890.0 will be relevant. Stop-loss – 7200.0. Implementation period: 7 days and more.
In the event of a reversal and continued growth of the asset, as well as price consolidation above the resistance level of 7250.0, buy positions with the target of 7430.0 and stop-loss of 7150.0 may be opened.
면책 조항: 본 게시글에 표현된 견해는 전적으로 작성자의 견해이며 Followme의 공식 입장을 대변하지 않습니다. Followme는 제공된 정보의 정확성, 완전성 또는 신뢰성에 대해 책임을 지지 않으며, 서면으로 명시적으로 언급되지 않는 한 해당 내용을 기반으로 취해진 어떠한 조치에 대해서도 책임을 지지 않습니다.

더 오래된 의견은 없습니다. 소파를 가장 먼저 잡으십시오.