· Views 120
면책 조항: 본 게시글에 표현된 견해는 전적으로 작성자의 견해이며 Followme의 공식 입장을 대변하지 않습니다. Followme는 제공된 정보의 정확성, 완전성 또는 신뢰성에 대해 책임을 지지 않으며, 서면으로 명시적으로 언급되지 않는 한 해당 내용을 기반으로 취해진 어떠한 조치에 대해서도 책임을 지지 않습니다.
이 글이 마음에 드시나요? 작성자에게 팁을 보내 감사의 마음을 전하세요.

| Scenario | |
|---|---|
| Timeframe | Weekly |
| Recommendation | BUY STOP |
| Entry Point | 117.50 |
| Take Profit | 127.00 |
| Stop Loss | 114.00 |
| Key Levels | 104.00, 105.00, 109.70, 113.40, 115.00, 117.50, 118.00, 120.00, 127.00 |
| Alternative scenario | |
|---|---|
| Recommendation | SELL STOP |
| Entry Point | 113.40 |
| Take Profit | 105.00 |
| Stop Loss | 116.00 |
| Key Levels | 104.00, 105.00, 109.70, 113.40, 115.00, 117.50, 118.00, 120.00, 127.00 |
The shares of RTX Corp., an American aerospace and defense conglomerate, are trading at 115.00.
On the daily chart, the price is correcting upwards, holding below the resistance line of the ascending channel 120.00–104.00.
On the four-hour chart, this movement has turned into a trend, confirmed by the recent price gap of 109.70–104.00, which wasn’t worked out. The target for the trend may be an exit from the channel with the quotes consolidation above 118.00.
Technical indicators are holding the buy signal: the fast EMA on the Alligator indicator are above the signal line, and the AO histogram is forming correction bars in the buy zone.
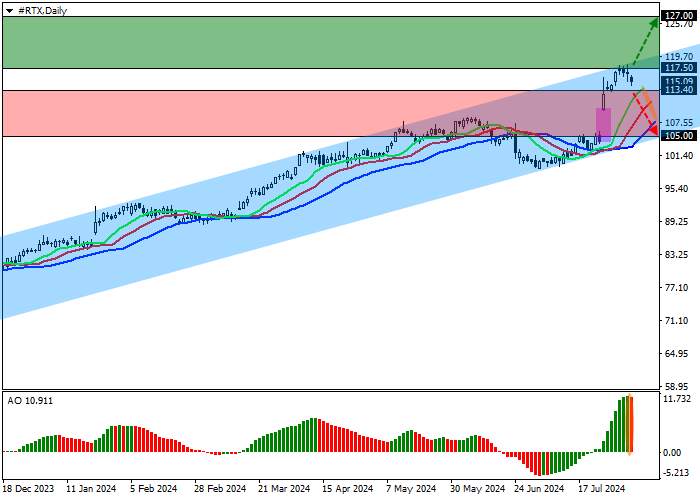
Trading tips
Long positions may be opened after the price grows and consolidates above the 117.50 level, with the target at 127.00. Stop loss — 114.00. Implementation period: 7 days or more.
Short positions may be opened after the price declines and consolidates below 113.40, with the target at 105.00. Stop loss — 116.00.
면책 조항: 본 게시글에 표현된 견해는 전적으로 작성자의 견해이며 Followme의 공식 입장을 대변하지 않습니다. Followme는 제공된 정보의 정확성, 완전성 또는 신뢰성에 대해 책임을 지지 않으며, 서면으로 명시적으로 언급되지 않는 한 해당 내용을 기반으로 취해진 어떠한 조치에 대해서도 책임을 지지 않습니다.

더 오래된 의견은 없습니다. 소파를 가장 먼저 잡으십시오.